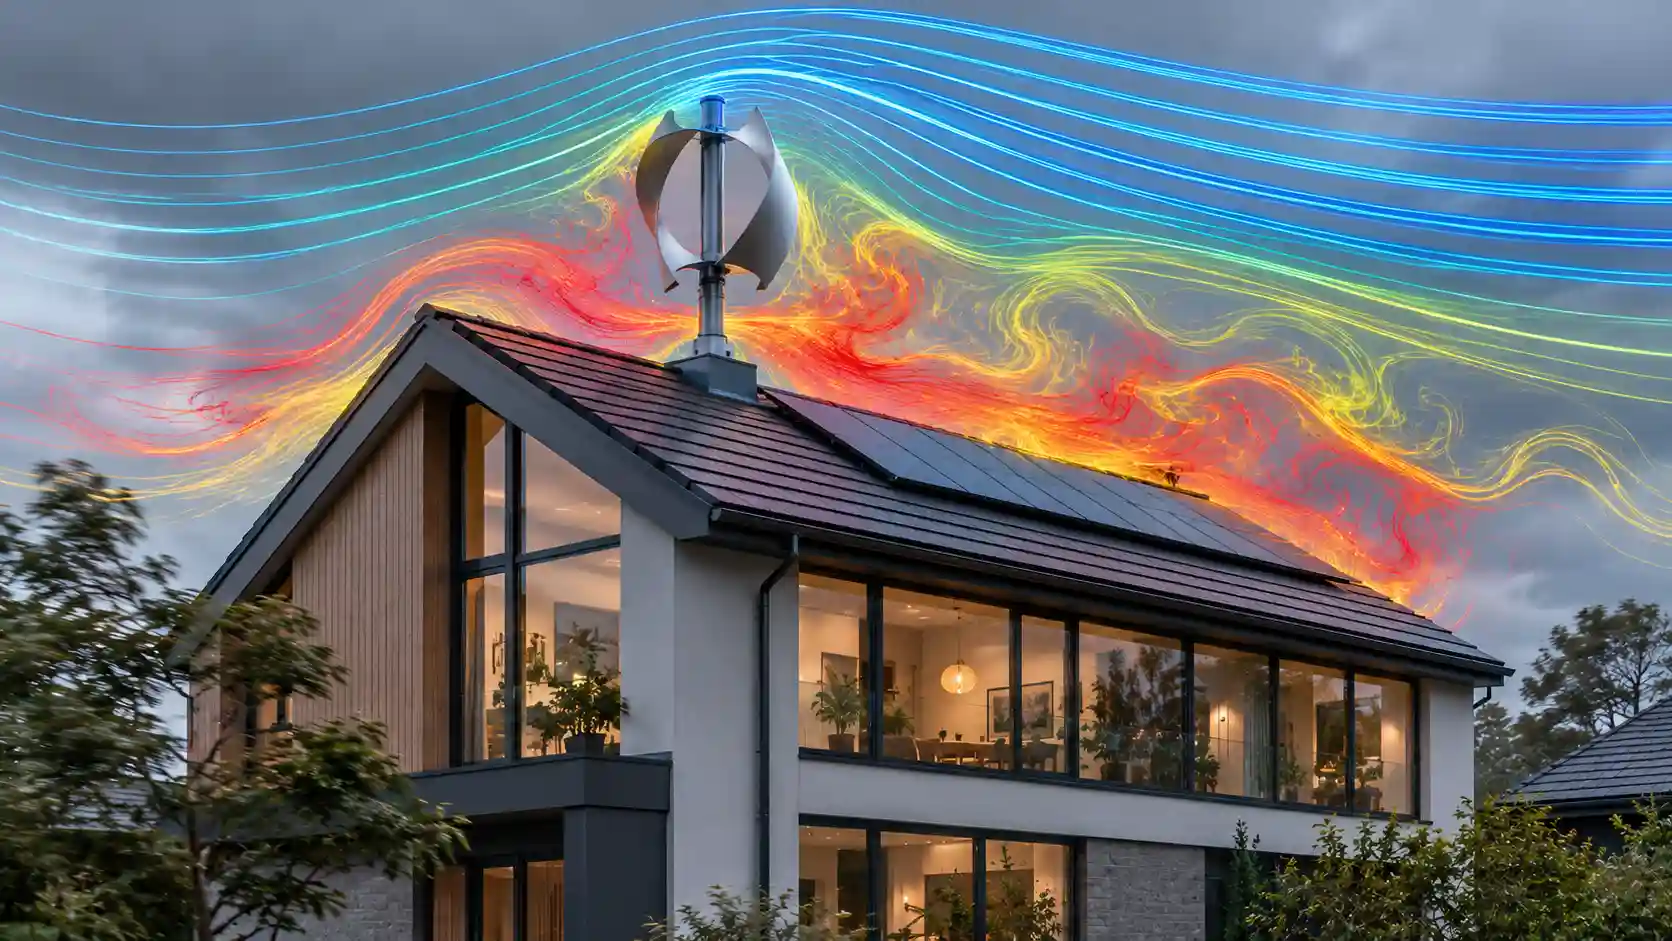
Micro-generation specifiers are routinely asked a deceptively simple question: if a household already has a photovoltaic array, why not add a small wind turbine to cover the dark, windy months? The proposition is intuitive, and the marketing around it is persuasive. The physics, however, is unforgiving. This audit characterises the aerodynamic, acoustic, structural and financial behaviour of sub-1 kW turbines in the built environment, and sets out the narrow set of preconditions under which micro-wind can legitimately act as a winter counter-weight to solar.
The Cube Law: Why Small Velocity Errors Become Large Power Errors
The kinetic power carried by a moving air stream through a rotor swept area is given by P = ½ × ρ × A × v³, where ρ is air density (approximately 1.225 kg/m³ at sea level and 15°C), A is the swept area in square metres and v is the free-stream wind speed in metres per second. The velocity term is cubed. This single feature of the equation governs every commercial and engineering conclusion that follows, because it means that power is not merely sensitive to wind speed; it is disproportionately and non-linearly sensitive to it.
Consider a typical 1 kW-rated domestic turbine with a rotor diameter of roughly 2 m, giving a swept area of about 3.14 m². At a clean, undisturbed wind speed of 5 m/s, the available kinetic power in the air stream is approximately 240 W. Reduce that speed to 4 m/s, a drop of only 20 per cent, and the available power falls to roughly 123 W, a loss of 49 per cent. At 3 m/s the stream carries only about 51 W, or 21.6 per cent of the 5 m/s figure. Halve the wind speed and the available power collapses to one-eighth. A specifier who treats wind speed as a linear input will therefore overstate yield by a factor that grows quickly with every metre per second of error.
The Betz Limit and the Real Power Coefficient
Not all of that kinetic power can be extracted. In 1919 Albert Betz demonstrated that an ideal actuator disc can recover at most 16/27 of the power in the free stream, approximately 59.3 per cent, because the air must retain enough residual velocity to leave the rotor plane. This is a thermodynamic and momentum-conservation ceiling that no blade geometry can exceed. Utility-scale three-bladed machines operating in well-managed flow reach a power coefficient (Cp) of around 0.45 to 0.50 at their design tip-speed ratio, which is why they are regarded as exceptionally efficient.
Small turbines do not enjoy those conditions. Their rotors operate at low Reynolds numbers, where blade boundary layers are thicker, laminar separation is more likely and lift-to-drag ratios degrade sharply. Manufacturing tolerances on small blades, simple fixed-pitch designs and the absence of active yaw and pitch control all compress the usable Cp window. A realistic peak Cp for a good small horizontal-axis machine is 0.30 to 0.35, and for vertical-axis designs frequently 0.20 to 0.30. Applying a Cp of 0.35 to the 240 W available at 5 m/s gives roughly 84 W of mechanical output, before generator, rectifier and inverter losses are deducted. The headline rating of 1 kW is typically quoted at 11 to 12.5 m/s, a wind speed that is rare at roof height in any suburban postcode.
Boundary Layer Turbulence: Where Laminar Flow Goes to Die
The atmospheric boundary layer is the region in which wind speed is retarded by surface friction. Over open terrain, speed increases with height following a logarithmic profile governed by the surface roughness length. Over a suburban canopy of houses, trees and outbuildings, the roughness length rises by orders of magnitude, and a displacement height develops: the effective ground plane is lifted towards the average roofline. Within and immediately above that roughness sublayer, the flow is not a smooth, directional stream. It is a population of shed vortices, recirculation zones and rapidly changing wind vectors.
A standard two-storey house presents a bluff body to the wind. Flow separates at the windward eaves and ridge, forming a separation bubble that can extend over the roof surface for several ridge heights downwind. A turbine bracketed to a gable or chimney stack frequently sits inside this wake. The consequences are twofold. First, the mean wind speed at the rotor is reduced, and through the cube law, the power falls disproportionately. Second, turbulence intensity, the ratio of the standard deviation of wind speed to the mean, rises well above the 10 to 15 per cent typical of open sites and can exceed 30 to 40 per cent in the roof wake. High turbulence intensity forces the rotor to chase continually changing inflow angles and speeds, so the machine spends much of its operating life well away from its optimum tip-speed ratio.
Yaw behaviour compounds the loss. A horizontal-axis turbine must rotate its nacelle to face the wind. In rapidly veering, gusty flow the yaw mechanism lags, and the rotor operates in skewed inflow where the effective swept area facing the wind is reduced by the cosine of the misalignment angle, while cyclic loading on the blades increases. Vertical-axis designs avoid yaw but suffer dynamic stall and blade-wake interaction in the downwind half of the rotation, which depresses Cp further and generates strongly pulsating torque.
Chimney stacks deserve a specific note. They are often chosen as mounting points because they are structurally substantial and tall. Aerodynamically, however, a chimney is a bluff cylinder that sheds Von Kármán vortices at a frequency governed by the Strouhal relationship, approximately f = St × v / d. A turbine mounted in this shedding wake experiences a periodic forcing function that can excite blade and tower resonances, a point that links the aerodynamic analysis directly to the structural audit below.
Real-World Yields Versus Marketing Claims
The gap between advertised and measured output is the central commercial issue in this sector. Low-cost online kits frequently advertise rated outputs of 3,000 W, 5,000 W or even higher on rotors barely a metre across. Such figures are physically impossible from the stated swept area at any plausible wind speed: a 1 m diameter rotor has a swept area of only 0.79 m², and even at a gale-force 15 m/s with the Betz limit applied in full it could not deliver the quoted rating. These products are typically uncertified, have no independent power curve and are specified using a peak, unsustained or entirely notional figure.
Independent field monitoring of certified and uncertified roof-mounted units across the UK has consistently produced yields that are negligible in comparison with the claims. Across the fleet of roof-mounted installations, the average annual output is approximately 78 kWh. For a nominal 1 kW machine, that equates to a capacity factor of under 1 per cent (78 kWh divided by 8,760 hours), against 25 to 40 per cent for well-sited utility-scale turbines. At a 2026 import tariff of around 25p per kWh, 78 kWh is worth under £20 per year.
The ancillary electronics frequently erase even that. A grid-tie inverter or charge controller draws a continuous standby load, commonly 5 to 10 W, for the entire year. Continuous consumption at those levels amounts to 44 to 88 kWh annually, which is equal to, or greater than, the energy the roof turbine delivers. In poor urban sites the installation can therefore be a net consumer of electricity. A competent specifier should always request the inverter standby figure alongside the power curve and should net it off the projected generation before any payback calculation is attempted.
Certification is a useful filter. Products tested under the MCS 006 small wind turbine standard (which references IEC 61400-2 and the IEC 61400-12 power performance methodology) carry a measured power curve and a declared annual energy yield at defined reference wind speeds. A product without that evidence should be treated as having an unverified yield, and an installer relying on an unverified yield assumes a significant professional liability.
Comparative Matrix: Mounting Architecture and Performance
| Parameter | Roof-Mounted Horizontal-Axis (HAWT) | Roof-Mounted Vertical-Axis (VAWT) | Certified Pole-Mounted Mast (Exposed Rural Site) |
|---|---|---|---|
| Turbine Mounting Architecture | Bracket or pole fixed to gable wall, chimney stack or rafters; hub typically 1–3 m above the ridge line | Compact rotor on short post bolted to roof structure or parapet; hub often below or level with the ridge | Free-standing guyed or tilt-up tubular mast on engineered concrete foundation; hub at 9–15 m or higher |
| Primary Aerodynamic Flow Profile | Separated, highly turbulent wake from the building; turbulence intensity commonly above 30% | Skewed, gusty inflow tolerated via omnidirectional rotor, but dynamic stall and wake interaction depress Cp | Near-laminar, logarithmic boundary-layer profile; turbulence intensity commonly 10–15% |
| Average Annual Energy Yield (600 W–1 kW Rated Basis) | Approximately 78 kWh fleet-wide average; often below inverter standby consumption | Typically at or below the HAWT average; frequently under 50 kWh | Site-dependent; typically 1,000–2,500 kWh on a good coastal or elevated site with a certified power curve |
| Acoustic & Structural Vibration Footprint | High: structure-borne vibration and low-frequency tonal noise coupled into the timber frame | Moderate to high: pulsating torque ripple transmitted as a low-frequency pulse through the fixings | Low at the dwelling: vibration is isolated by the foundation, and acoustic separation distance reduces nuisance |
| Capital Expenditure Range (UK Market 2026) | £1,500–£4,000 installed; low capital cost but very poor return | £2,000–£5,000 installed; premium pricing with little measured yield benefit | £15,000–£30,000 including mast, foundation, cabling, inverter and commissioning |
The matrix makes the structural problem plain. The cheap architectures are cheap because they omit the one thing that produces energy, which is clean, high-velocity air. The architecture that does supply clean air carries a capital cost an order of magnitude higher and is only appropriate where site conditions justify it.
Structural Acoustics: Infrasound and Shear Vibration in Timber Frames
Mounting a rotating machine directly onto a dwelling converts the building into an acoustic radiator. A typical UK roof is a lightweight timber structure: softwood rafters or trussed rafters at 400 to 600 mm centres, battens, tiles and plasterboard ceilings. This is a low-mass, low-damping system with several natural frequencies in the range of roughly 5 to 40 Hz, precisely the band in which rotor-driven excitation occurs.
Excitation sources are well understood. Rotor imbalance produces a force at the rotational frequency (1P). Blade passing produces forcing at N times the rotational frequency (NP, where N is the number of blades). Tower shadow, yaw gyroscopic moments and vortex shedding from the chimney or mounting bracket add further harmonics. For a small rotor turning at 200 to 600 rpm, 1P lies between about 3 and 10 Hz and a three-bladed 3P component between about 10 and 30 Hz. Those frequencies sit immediately beside the first bending modes of rafters and the plate modes of ceiling linings. If an excitation harmonic coincides with a structural natural frequency, resonance amplifies the response by a factor equal to the quality factor Q of the mode, and in a lightly damped timber structure that can mean an order-of-magnitude amplification.
Two transmission paths operate in parallel. The structure-borne path carries shear and axial vibration from the bracket through the fixings into the rafters, then through the wall plates and ceiling hangers into the habitable space, where the ceiling radiates it as audible low-frequency noise and perceptible floor-level vibration. The airborne path radiates blade-passing tones, aerodynamic broadband noise and, at the lowest frequencies, infrasound below 20 Hz directly from the rotor. Infrasound is not usually audible at the levels involved, but it can be felt as pressure and can cause annoyance, particularly at night when background levels are low. Because wavelength at 10 Hz is over 30 m, conventional lightweight roofs and glazing provide almost no attenuation at these frequencies; mass law insulation performance is poor at the low end of the spectrum.
Building services engineers should also consider the effect on the fabric itself. Cyclic loading of fixings at millions of cycles per year drives fatigue in a way that static design checks do not capture. Lag screws and coach bolts in softwood loosen under repeated reversing load, the timber around the bore crushes and enlarges, and the fixing capacity degrades progressively. Mortar around a chimney stack, never designed to carry cyclic overturning moments, will crack and spall, opening a water ingress path. Roof tile and flashing seals around penetrations fatigue and leak. A turbine in a 6 m/s mean wind cycles through roughly 10 to 30 million rotations per year, so a modest per-cycle damage increment accumulates quickly. The structural engineer should also be asked to verify the additional overturning moment under extreme gust loading, which for a rotor on a roof can approach levels the original design did not anticipate. Insurers increasingly require this assessment, and failing to supply it can invalidate cover.
Isolation measures such as elastomeric mounts, tuned mass dampers and rafter strengthening can reduce transmission, but each adds cost, and none improves the underlying aerodynamic resource. Mitigating a vibration problem on a turbine that produces 78 kWh a year is an expensive way of managing a negligible asset.
Geographic and Capital Boundaries for Viable Deployment
None of this means micro-wind is never valid. It means the viable envelope is narrow and can be defined with some precision. The case for wind as a winter counter-weight to solar is genuine: in the UK, photovoltaic output in December is typically under 10 per cent of the June figure, while mean wind speeds in the winter months are materially higher than in summer. The two resources are complementary in time. The difficulty is not the concept but the resource quality at the specific site.
The following preconditions should all be satisfied before a specifier recommends micro-wind:
- Measured annual mean wind speed: a site-verified mean of at least 5.5 to 6 m/s at hub height. Desk-top databases that report 5 m/s at 10 m above ground generally overstate the resource for a sheltered plot and should not be used without correction for local roughness and obstacles.
- Hub height and clearance: the rotor should sit at least 9 to 10 m above the surrounding terrain and obstacles, and ideally above any obstacle within 100 m by a clear margin of two to three obstacle heights.
- Open exposure: coastal frontage, a headland, a hilltop or an upland plateau, with flow free from tree lines, farm buildings and adjacent dwellings across the prevailing south-westerly sector.
- Certified equipment: a turbine with an independently measured power curve and a declared annual energy yield under MCS 006, installed by an MCS-certified installer, which is also a prerequisite for most export tariff eligibility.
- Foundation and mast engineering: a purpose-designed concrete foundation, geotechnical assessment, appropriate tilt-up or guyed mast and a full electrical protection scheme including lightning and surge protection.
- Planning and grid: planning consent where required, noise assessment against neighbouring receptors, and a DNO connection application (G98 or G99 as appropriate) before ordering equipment.
The logistical demands at open coastal or high-elevation rural sites are significant. Crane or winch access for mast erection, cable runs of tens or hundreds of metres, corrosion protection against salt-laden air, icing allowances on elevated terrain, and an inspection regime for bearings and blades all feed into whole-life cost. Maintenance for a small turbine is not negligible: bearings, slip rings and brushes have finite service intervals, and annual inspection is the norm.
Capital Expenditure and Payback Horizon
A certified pole-mounted installation costing £15,000 to £30,000 and yielding, say, 1,500 to 2,500 kWh per annum on an excellent site delivers energy worth roughly £375 to £625 at a 25p per kWh displaced import value, with any Smart Export Guarantee revenue on top at much lower unit rates. Simple payback on that basis runs to several decades, comfortably beyond the 20-year design life of most small machines, before maintenance and inverter replacement costs are included. Only where the system displaces expensive off-grid diesel generation, or where the household has an unusually high winter demand and an unusually good site, does the arithmetic begin to close.
By contrast, a fraction of the same capital deployed in additional photovoltaic capacity, battery storage, a heat pump or fabric insulation typically produces a faster return and carries none of the vibration, planning or maintenance risks. For residential decarbonisation consultants, the prudent default recommendation for a standard suburban plot is therefore to exclude micro-wind from the specification, and to invest instead in measures with a quantified, certified and bankable return.
Specifier Checklist
- Reject any product that lacks an independently measured power curve or MCS 006 certification.
- Calculate swept area and apply the Betz limit as a sanity check on every headline rating.
- Obtain on-site wind measurement or a corrected resource assessment; never rely on postcode averages.
- Net inverter and controller standby consumption off projected generation.
- Commission a structural and vibration assessment before any attachment to a dwelling.
- Model payback with realistic yields, maintenance and replacement costs, and compare against alternative decarbonisation measures.
Conclusion
Small wind turbines fail in the suburbs not because of poor engineering intent but because the resource they depend on has been destroyed by the built environment before it reaches the rotor. The cube law converts modest velocity deficits into severe power losses, boundary layer turbulence degrades what remains, inverter standby consumption erodes the residual output, and the structural coupling to a timber roof introduces noise and fatigue risks that outweigh the benefit. The conclusion for building services specifiers, installers and decarbonisation consultants is consistent: treat roof-mounted micro-wind as an unproven and generally uneconomic technology, and reserve certified, pole-mounted systems for the small number of genuinely exposed rural sites where measured data supports the investment.