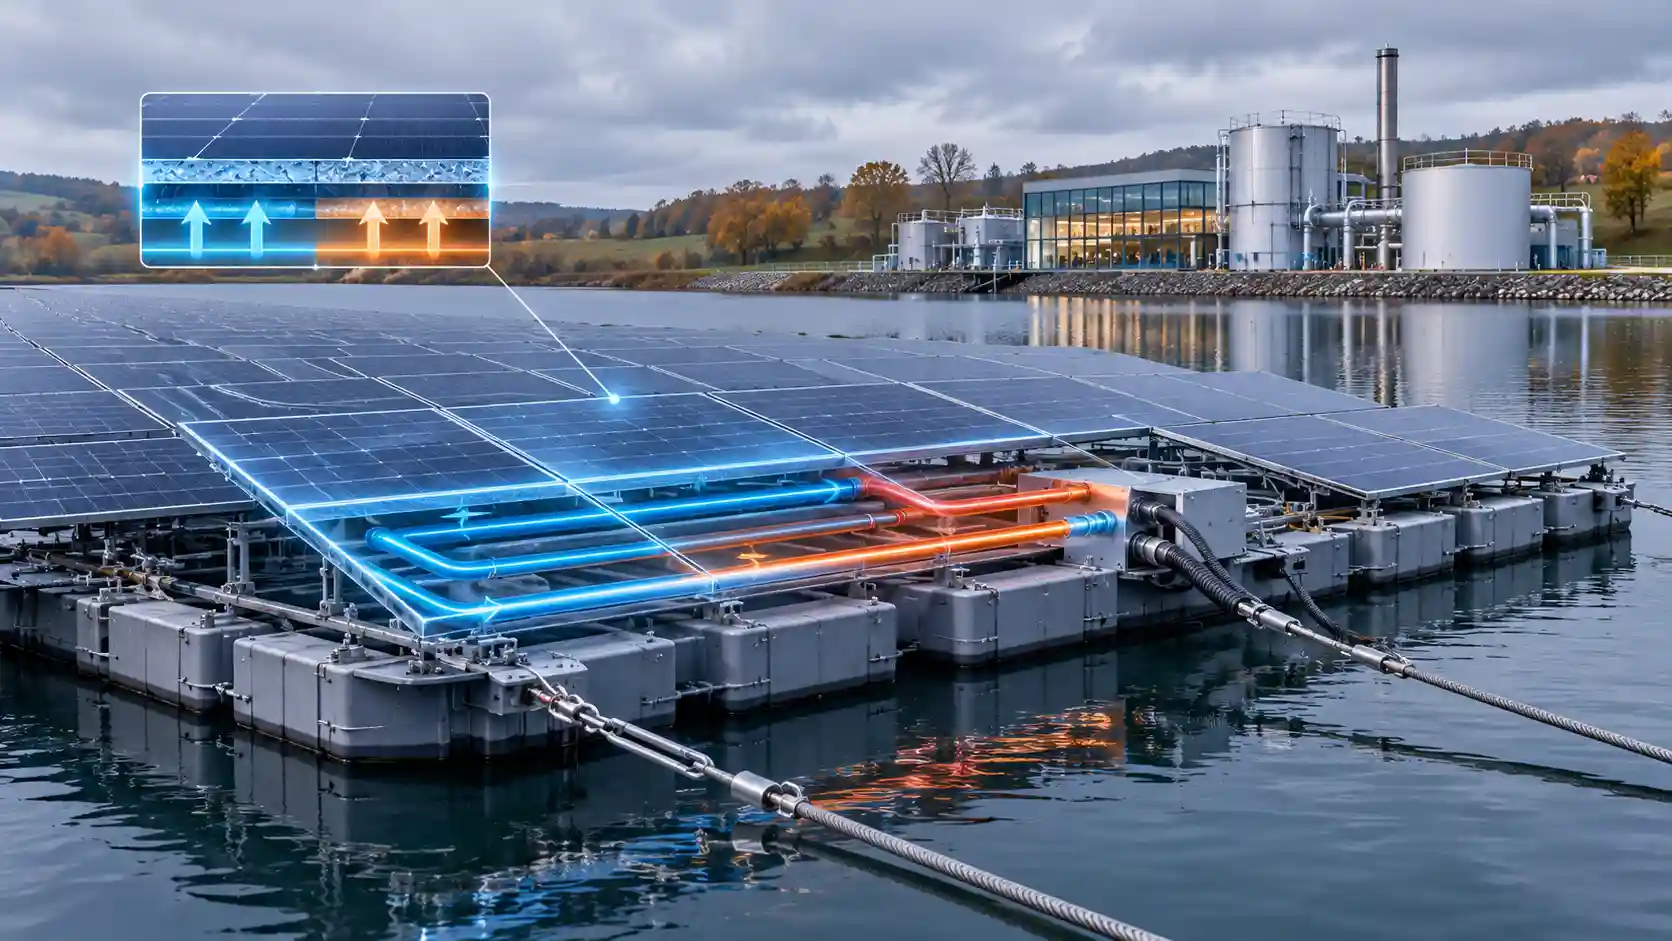
Floating photovoltaics (FPV) attract more viral enthusiasm than almost any other solar format, and more misunderstanding. Images of solar panels rafted across a canal or moored over a salmon farm circulate widely, usually without any reference to hydraulics, navigation law, wave climate or grid topology. This article audits the technology against the actual conditions of the British water estate, for water utility asset directors, commercial solar specifiers, hydraulic structural engineers and infrastructure investors. The central conclusion is that UK floating solar is neither a gimmick nor a universal solution. It is a specialised asset class whose economics are strongest on managed, stationary, industrial water bodies with a co-located electrical load. Numerical examples are standardised calculations with representative parameters; they characterise orders of magnitude and design logic and are not substitutes for site-specific hydrographic, geotechnical and electrical studies.
1. Thermodynamics of Open-Water Cell Cooling
A photovoltaic cell converts only a fraction of incident irradiance into electricity, typically 18 to 22 per cent for current module technology, and the remainder is rejected as heat. The steady-state energy balance for a module is G × (tau-alpha) × (1 - eta) = U × (Tc - Ta), where G is the plane-of-array irradiance, (tau-alpha) the effective transmittance-absorptance product (about 0.9), eta the electrical efficiency, U the total heat loss coefficient to the surroundings, Tc the cell temperature and Ta the ambient temperature. For a module at 1,000 W/m² and 20 per cent efficiency, the heat to be dissipated is about 1,000 × 0.9 × 0.8 = 720 W/m². With a combined front and rear loss coefficient of 24 W/m²K, typical of a ventilated roof or ground-mount in a light breeze, the cell runs about 30 K above ambient. At 25 degrees ambient that means roughly 55 degrees, which is why datasheets quote a nominal operating cell temperature well above the 25-degree standard test condition.
Convective loss from a flat surface depends on wind speed. A common engineering correlation is h = 5.7 + 3.8v, with v in metres per second and h in W/m²K, which gives about 9.5 W/m²K at 1 m/s and 17 W/m²K at 3 m/s on each exposed face. Radiative exchange adds approximately 4 × emissivity × Stefan-Boltzmann constant × T³, or around 5 to 6 W/m²K for a surface at 300 K with emissivity 0.9, but the radiative sink matters: a rear face radiating to a cold sky or a cool water surface exchanges heat more effectively than one radiating to a warm roof deck.
Floating arrays modify this balance in several ways. The first is the boundary condition on the rear face. Water has a specific heat capacity of 4.18 kJ/kgK and a vast thermal mass relative to the heat input of an array. A reservoir surface in a UK summer typically sits at 16 to 22 degrees, several kelvin below peak afternoon air temperature, and it changes slowly over days. The rear of a floating module therefore faces a sink at a lower and more stable temperature than a rooftop or a ground-mount. The second is the moist microclimate over the water surface. Evaporation extracts latent heat of about 2.45 MJ/kg, and a thin humid boundary layer forms over the surface, with air temperatures a degree or two lower than over adjacent land at the time of peak irradiance. The third is wind: open water generally has a lower surface roughness than land, so wind speeds at array height are higher than over built-up or vegetated sites, which raises the convective coefficient.
The fourth effect works against cooling and is often overlooked. Many floating designs use closed HDPE pontoons with arrays mounted at shallow tilts of 5 to 15 degrees, only a few tens of centimetres above the surface. High-density polyethylene has a thermal conductivity of about 0.45 W/mK and a pontoon wall of 5 millimetres contributes a conductive resistance of only about 0.011 m²K/W, which is negligible, but a closed, low-clearance geometry restricts airflow beneath the module and can trap warm air. Designs differ materially: elevated, ventilated systems rely on wind, whereas close-coupled systems with modules sitting almost on the water rely on conduction and radiation to the surface. The cooling benefit is therefore a design property and not a universal feature of floating solar.
The performance consequence follows from the temperature coefficient. For a module with a power coefficient of -0.35 per cent per kelvin, a reduction in cell temperature of 5 to 10 K at peak irradiance raises output by 1.75 to 3.5 per cent at that moment. Considering voltage specifically, a silicon cell has a Voc temperature sensitivity of about -2.1 mV/K, so a 15 K reduction raises Voc by roughly 31 mV per cell, which is about 2.3 V on a 72-cell series string. This is the mechanism behind the stabilisation of open-circuit voltage under peak irradiance and the headroom it gives against inverter minimum-voltage thresholds on hot afternoons.
Published field comparisons of floating and land-mounted systems report annual energy gains that vary widely, from approximately zero in cool, windy temperate sites to around 5 to 10 per cent in hot climates, and the gain at peak-summer hours can exceed the annual average by a wide margin. Claims of a 10 to 12 per cent uplift in peak summer yield are plausible for the hottest hours and for bifacial modules benefiting from low-albedo-but-diffuse reflection off the water, but they should not be treated as an annual UK average. A prudent planning basis for UK reservoir systems is an annual gain of 1 to 5 per cent against a comparable ground-mount, to be confirmed by site modelling that includes measured water temperatures, wind records and the specific float geometry. Against this must be set offsets such as higher soiling from bird activity, higher humidity-related degradation risk and small tilt and orientation compromises dictated by the float system.
2. Spatial and Hydraulic Constraints: Why Canals Fail
The UK inland waterway network, around 2,000 miles under the Canal and River Trust, was designed for horse-drawn and later motorised boats. A typical narrow canal has a water surface width of 10 to 15 metres, a navigation channel that must remain clear for vessels of 2.1 metres beam (narrowboats) or wider on broad canals, and a legal and operational requirement to maintain headroom, sightlines, mooring and towpath access. Navigation authorities are charged with keeping waterways open to boats, anglers, walkers and wildlife, which immediately restricts the proportion of the surface available for permanent cover.
Three physical features then remove most of the remaining resource. Shading is the first: canal corridors are frequently lined with mature trees, embankments, cuttings, bridges and buildings, so a large share of the surface is shaded for much of the day. Solar yield falls steeply with shading because a partially shaded module in a series string constrains the whole string unless bypass diodes and optimisers intervene. Flow and wash are the second: although canals are slow-moving, boat wake at a few kilometres per hour generates wave heights of 10 to 20 centimetres that act repeatedly on floating equipment and moorings, and the narrow section means those waves reflect off both banks and superpose. Water level management is the third: pound levels in lock-controlled canals vary over limited ranges but are changed deliberately during maintenance and drought operations, and the banks are historic structures that have strict loading limits and ecological protections.
Overseas canal-top systems, notably in the irrigation canals of India and in pilot projects in the western United States, work because the canals there are wide, straight, unshaded, non-navigable and often lined with concrete, and because the cover provides evaporation savings in hot dry climates. A framework suspended on gantries over the water, rather than floating on it, is the usual solution. None of these conditions applies to the typical UK navigation. Small niche applications on off-line basins, marinas, redundant canal arms and industrial feeder channels remain possible, but they are exceptions that will not scale to a large fraction of the network.
3. Spatial and Hydraulic Constraints: Why Marine Cages Fail
Co-location with aquaculture is an appealing concept. Scottish salmon farms occupy sheltered sea lochs and consume electricity for feed barges, lighting, pumping and oxygenation. A floating array would shade nothing useful in this case but could displace diesel generators. The obstacle is the wave and current environment.
Wave height in fetch-limited conditions can be estimated from the simplified relation Hs = 0.0016 × U × sqrt(F/g), where U is the wind speed in m/s, F the fetch in metres and g the acceleration due to gravity. For a reservoir with a 2 kilometre fetch under a 20 m/s wind, Hs = 0.0016 × 20 × sqrt(2,000/9.81) = 0.46 m. For a sea loch with a 20 kilometre fetch under a 25 m/s wind, Hs = 0.0016 × 25 × sqrt(20,000/9.81) = 1.8 m, before adding swell entering from the open sea, tidal currents and surge. The wave energy flux per metre of crest scales as Hs² multiplied by the energy period, approximately 0.49 × Hs² × Te in kW/m. With Te of 2.5 s for the reservoir, this is about 0.26 kW/m, while with Te of 5 s for the loch it is about 7.9 kW/m, roughly thirty times greater.
The consequences for a rigid floating array are severe. Modules mounted on a rigid raft respond to wave slope with continuous cyclic flexing at the joints between floats, fatiguing connectors, cables and glass. The number of wave cycles at 0.2 Hz is about 6 million per year, and each can impose bending moments at the float joints. Mooring loads grow with the square of wave height and with the added mass of the structure. Seawater introduces corrosion of aluminium frames and galvanic couples, chloride-induced degradation of junction boxes and connectors, biofouling that increases drag and weight, and ultraviolet and salt-mist damage to the encapsulant. Cabling needs dynamic subsea umbilicals rated for continuous flexing. Some demonstration projects in the North Sea and elsewhere have developed flexible membrane designs that follow the wave surface, and these may develop into viable products, but they remain at pilot scale and have not been deployed commercially in UK aquaculture. For the current investment horizon, the sea cage is therefore a technically unproven environment with a disproportionately high cost of capital.
4. Mooring Mechanics and Elasticity
Stationary water bodies still impose engineering challenges. Floating arrays must be held in position against wind, current and wave loads while accommodating changes in water level. For a reservoir the drawdown range can be several metres between full supply level and a drought low, and for a tidal or impounded dock the variation is controlled by the lock operation.
Wind loading provides the governing horizontal force in most inland cases. Dynamic pressure is q = 0.5 × rho × V². For air at a density of 1.225 kg/m³ and a design gust of 40 m/s, q = 0.5 × 1.225 × 1,600 = 980 Pa. A shallow-tilt array presents a modest frontal area, so its net horizontal force coefficient on plan area is low, perhaps 0.1 to 0.2 depending on tilt, row spacing and edge effects. For one megawatt-peak of modules covering about 5,000 m², a coefficient of 0.15 gives a horizontal load of 0.15 × 980 × 5,000 = approximately 735 kN. If this is shared among 20 mooring lines in a spread pattern, the mean load per line is about 37 kN, and the lines nearest the windward edge carry a higher share, so the design should assume a peak-to-mean factor of 1.5 to 2 and apply partial safety factors on top. Uplift on the modules is a separate check, since low-tilt arrays can experience wind lift equal to or exceeding their weight.
Level changes require compliance in the mooring. A taut mooring line cannot tolerate a vertical change in the float position without a large tension increase, so lines are typically installed with slack, counterweights or elastic elements. The stiffness of a synthetic line is k = EA/L, where E is the effective elastic modulus, A the cross-sectional area and L the length. A polyester rope of 40 mm diameter, with an effective axial stiffness EA of about 3 MN, and an unstretched length of 30 m has a stiffness of 100 kN/m. Allowing 0.3 m of extension under a 30 kN load seems reasonable in this configuration, but tolerating a level change of several metres demands either very long lines or a mechanism, such as sliding rings on bank-side piles, spring-loaded pulleys or catenary chain sections, that decouples the line length from the level. Anchors may be dead-weight concrete blocks, driven piles, helical screw anchors or drag-embedment anchors on a soft bed, depending on the geotechnical conditions. Embankment anchors on a reservoir require a stability check of the embankment itself, and any alteration to a reservoir structure is regulated under the Reservoirs Act 1975, with supervision by a panel engineer.
Hydrodynamic coupling must also be considered. The float system acts as a damped mass-spring oscillator on the water surface, and the natural frequency of the heave, pitch and roll modes should be well separated from the dominant wave periods of the site. Interconnections between float modules, usually hinged or flexible couplings, need to survive the fatigue loading of the lifetime wave spectrum, together with thermal expansion of the HDPE, which has a coefficient of approximately 150 to 200 ppm per kelvin, much larger than steel or glass. Over a 10-metre float row a 40 K temperature change produces expansion of several centimetres that the coupling must absorb.
5. Water Quality, Algae and Chemical Treatment Economics
A distinctive benefit of reservoir FPV for water utilities lies in water quality. Summer algal and cyanobacterial blooms are driven by light, temperature and nutrients, and they cause taste and odour compounds (geosmin and 2-methylisoborneol), toxins such as microcystins and increased filter clogging at the treatment works. Utilities respond with coagulant and powdered activated carbon dosing, additional ozone or oxidant use, more frequent backwashing and, in severe cases, supply restrictions or source switching.
Shading a fraction of the water surface reduces the photosynthetically active radiation available beneath it, and surface cover also reduces wind mixing and surface heating. Coverage of 10 to 30 per cent is commonly cited as the range at which noticeable algal suppression occurs, although effects vary by reservoir and require site-specific monitoring. Evaporation falls beneath the covered area, with reductions of 30 to 70 per cent in covered zones reported, although in the cool, humid UK the absolute water saving is small compared with arid regions, since typical annual open-water evaporation is only 450 to 550 mm.
The financial benefit is hard to generalise, but its structure is clear. If a utility spends, for illustration, several hundred thousand pounds per year in a bloom-prone catchment on carbon dosing, additional oxidants and sludge disposal, a reduction of 10 to 20 per cent from partial cover is worth tens of thousands of pounds per year. This is a secondary benefit that improves the investment case without driving it. It must be balanced against ecological considerations: reduced light affects submerged plants, oxygen dynamics beneath the cover must be monitored, and bird use of the water surface can change. Environmental permits, ecological assessments and, where the water is a designated site, consultation with statutory bodies are essential, and the proportion of coverage is generally negotiated against these constraints.
6. Comparative Matrix: Water Body Environments
The matrix below compares the main UK water environments considered for floating solar. Yield variances are expressed against a comparable land-mounted array, capital expenditure is indexed with a conventional ground-mount at 100, and all figures are representative planning ranges, not quotations.
| Floating Solar Water Body Environment | Dominant UK Mechanical Deployment Mode | Thermodynamic Yield Variance | Primary Environmental/Operational Benefit | Grid Interconnection Topology | Relative Capital Expenditure Index |
|---|---|---|---|---|---|
| Managed inland water utility reservoir | HDPE pontoon arrays on shallow tilt, held by a spread of bank and bed anchors with compliant lines to tolerate drawdown | Approximately +1 to +5 per cent annually, higher in peak summer hours; reduced by soiling and low-clearance heat trapping | Algal bloom suppression, lower treatment chemical use, reduced evaporation beneath cover, land-sparing | Behind-the-meter medium-voltage link to adjacent treatment works, with optional export limitation | Approximately 130 to 160 |
| Impounded industrial dockland | Pontoon arrays anchored to the dock bed, with marine-grade corrosion protection and fixed water level through lock control | Approximately +1 to +5 per cent; salt mist, bird fouling and exposure to wind offset thermal gains | Land-sparing for manufacturing, direct supply to heavy industrial demand, use of otherwise unproductive water space | Private wire or behind-the-meter medium-voltage connection to adjacent industrial site, with grid as back-up | Approximately 150 to 180 |
| Navigable inland canal | Narrow rafts or gantry-mounted structures, constrained by navigation channel, bridges and locks; mostly theoretical in the UK | Approximately 0 to +3 per cent thermal gain, but shading and tree cover can cut yield by 10 to 40 per cent | Limited; potential minor evaporation and weed-growth reduction, offset by navigation and ecological conflicts | Low-voltage or 11 kV connection along the towpath to a distribution network operator, subject to access consents | Approximately 200 or more, with high consent risk |
| Open-sea loch and marine aquaculture site | Flexible membrane or semi-submersible rafts under development; heavy dynamic mooring and subsea umbilicals | Approximately +3 to +8 per cent thermal gain, offset by motion, soiling and corrosion losses | Potential diesel displacement for feed barges, but unproven under UK wave climate | Subsea or floating cable to shore or local microgrid, with high marine-grade protection | Approximately 250 or more, with technology risk |
The matrix shows why investment concentrates on stationary, controlled water bodies. The thermodynamic advantage is similar across environments and modest in the UK, whereas the structural, regulatory and interconnection costs diverge widely. The deciding variable is not the water but the combination of mooring simplicity and an adjacent electrical load.
7. Reservoir Case Study: Queen Elizabeth II Reservoir
The Queen Elizabeth II (QEII) Reservoir at Walton-on-Thames, owned by Thames Water, hosts one of the best-known European installations. Commissioned in 2016 by Thames Water with Lightsource Renewable Energy and Ennoviga Solar, the array has an installed capacity of 6.3 MWp across more than 23,000 modules and covers roughly a tenth of the reservoir surface. It was expected to generate in the order of 5.8 GWh in its first year, and the power supplies the neighbouring Walton water treatment works. At the time of commissioning it was described as the largest floating solar array in the world, a title long since passed to much larger Asian installations.
The engineering significance of QEII lies in the match between a large, continuous industrial load and a site with a pre-existing electrical connection. A treatment works runs pumps, ozone and ultraviolet disinfection, filters, backwash systems and sludge handling around the clock. Because the load is both large and fairly constant, a high proportion of solar output can be consumed on site. The array also forms part of Thames Water’s wider objective of self-generating a significant share of its energy, as the company said at the time. With a specific yield of around 900 kWh per kWp, a 6.3 MWp array produces about 5.7 GWh, consistent with the project expectation.
The project demonstrated that floating solar could be built on a drinking-water reservoir under the UK regulatory regime, including the Reservoirs Act, environmental permitting and drinking-water quality requirements for materials in contact with raw water. Float and component materials in contact with potable sources must be shown not to leach contaminants, which narrows the supply chain to tested products. Published operating data on the long-term interaction with water quality and wildlife is limited, so decision-makers should request measured performance figures directly from owners and operators.
8. Dockland Case Study: Barrow EnergyDock
The Barrow EnergyDock, promoted by Associated British Ports at Cavendish Dock in the Port of Barrow in Cumbria, is the most prominent UK example of floating solar designed around an industrial offtaker. According to the promoter and published coverage, the scheme is for up to 40 MWp of floating panels, approximately 47,000 modules by one account, covering about a third of the dock water area, and capable of supplying the equivalent of around 14,000 homes’ annual consumption. Development consent was granted by Westmorland and Furness Council in November 2025, and the promoter describes it as the UK’s largest floating solar project. The pontoons are to be secured to the dock bed by a specially designed anchoring system. The principal customer is the advanced manufacturing cluster in Barrow, including the submarine construction facilities, and readers should confirm the current construction and commissioning status directly with the developer, since consent and design parameters are public but delivery progress changes.
Several features make the dock a favourable setting. Cavendish Dock is an enclosed, impounded body with little wave fetch and controlled water levels, so mooring and hydrodynamic loads are low compared with open water. It has no navigation conflicts if the dock is not used by commercial shipping. It is adjacent to a heavy industrial load with a substantial electrical demand. And, crucially for the economics, it is brownfield water: land-sparing is a central advantage, since the same capacity on land would require several tens of hectares in an area where land is scarce and competes with industrial, port and offshore wind supply-chain uses. At typical ground-mount densities of 1 MWp per 1.5 to 2 hectares, a 40 MWp array equates to 60 to 80 hectares of land.
The challenges of a saline environment must be weighed. Dock water is brackish to saline, so aluminium frames, fixings, cable glands, connectors and earthing systems require marine-grade specification, with attention to galvanic compatibility. Bird activity on the floats, notably gulls, can lead to heavy soiling, requiring a cleaning strategy. Anchors set into the dock bed must account for sediment, historic structures and any contamination. The array also affects the dock’s use for other purposes and for ecology, such as shading effects on dock-edge habitats and local marine life, and these are central to the planning conditions. Capital cost for this specification sits at the upper end of the floating range, as the matrix indicates.
9. Behind-the-Meter Integration and Network Algorithms
The strongest financial argument for utility and dockland FPV is not the yield uplift but the interconnection route. Grid connection is currently one of the principal bottlenecks for UK generation development. Large projects entering the transmission and distribution queues face waits of several years, with reinforcement costs and uncertain dates, though national reforms to the connection process aim to prioritise projects that are ready and strategically useful. A generator located behind an industrial customer’s meter, sized so that its output is consumed on site, can be connected at the customer’s existing point of supply with a much smaller network impact.
Behind-the-meter does not mean unregulated. In Great Britain, generators connecting to the distribution network require an application under the engineering recommendations G99 (or G98 for very small installations), and the distribution network operator assesses fault levels, voltage rise and thermal capacity. Where the owner demonstrates that the system will not export, or will export below an agreed limit, the connection can use export limitation arrangements defined in engineering recommendation G100, which reduces or avoids the need for reinforcement. For a generator above the DNO thresholds, additional requirements apply, and larger embedded generators may need to participate in balancing arrangements. These requirements vary by site and must be confirmed with the relevant network operator.
The central economic variable is the self-consumption ratio, SCR = sum over time of min(G(t), L(t)) divided by the sum of G(t), where G is the solar generation and L the site load in each half-hour. The coverage fraction is the sum of min(G, L) divided by the sum of L. A treatment works or heavy manufacturing site with a flat baseload higher than the peak array output will have SCR close to 100 per cent. As array size approaches the load, midday output exceeds demand during summer and SCR falls, so sizing is an optimisation: choose the capacity that maximises net present value after allowing for the diminishing value of exported energy.
A basic dispatch and control loop for such a site can be described in algorithmic terms. For each settlement period the controller reads the array output, the site load, the grid import and any storage state of charge. If generation exceeds load, it first charges any available storage, or shifts flexible loads such as pumping into the period, then reduces output through inverter power limiting if an export cap applies. If load exceeds generation, it imports the deficit from the grid. Flexible water loads are particularly valuable: a treatment works with service reservoirs and balancing tanks can schedule pumping into the solar window and defer it out of peak-price periods, converting the load profile into something closer to the generation profile at no capital cost. A forward-looking optimiser combines generation forecasts, price forecasts and tank levels to schedule pumping while meeting hydraulic constraints.
The financial value of avoided import is considerable. Take the Barrow figure of 40 MWp at a specific yield of 900 kWh per kWp, equal to 36 GWh annually. If every kWh displaces industrial electricity with an all-in delivered cost, including non-commodity charges, of, for illustration, £90 per MWh, the annual value is about £3.2 million. If a proportion of generation were exported at a lower price, the average would fall. Capital cost at, for planning, £0.8 to £1.1 million per MWp for floating systems on difficult sites gives £32 to £44 million, so simple payback lies in the region of 10 to 14 years before incentives, financing costs and operating costs, and varies materially with the avoided tariff. The result is highly sensitive to the delivered electricity price, so the long-term power purchase arrangement is as important to the investment case as the engineering. Changes to regulated network charges, including the removal of many embedded benefits in recent years, mean avoided network charges should be modelled conservatively.
Avoiding the queue also has an option value. A project that can energise in 24 to 36 months, rather than waiting for a transmission or distribution reinforcement scheduled for the end of the decade, starts earning revenue sooner, reducing the carrying cost of development capital. For a fund, bringing forward cash flows by three to five years can raise the internal rate of return by several percentage points, even before the avoided reinforcement cost is counted.
10. Capital Structure, Operations and Risk
Floating solar capital costs are higher than land-based systems because of the float structure, anchoring, marine-grade components, specialist installation methods and the need for water-based commissioning. A planning range of 20 to 60 per cent premium to ground-mount is defensible for stationary water bodies, widening for harsher conditions. Operating costs include inspection of mooring lines and anchors, float integrity checks, cleaning, cable inspection, vegetation or bird management and insurance, which is often priced at a premium for novel marine assets.
Principal technical risks include float degradation from ultraviolet exposure and thermal cycling, connector and cable fatigue from motion, biofouling and bird-related soiling, anchor drift and fatigue of mooring components, electrical safety on water including insulation monitoring and earth-fault detection, and fire risk and access for emergency response on a floating platform. Financial and regulatory risks include consent conditions that limit surface coverage, changes in tariffs for the offtaker, and the creditworthiness and term of the power purchase counterparty. For water utilities, a particular risk is that any materials or cleaning chemicals used must be compatible with raw-water quality obligations. Lenders will require independent technical due diligence, including a hydrographic and geotechnical survey, a mooring design review, long-term degradation data on float materials and a clear operations and maintenance plan.
11. Practical Guidance by Stakeholder
- Water utility asset directors: screen reservoirs by coverage potential, bloom history, drawdown range, proximity to treatment works and embankment constraints. Model the self-consumption ratio on measured half-hourly demand and evaluate flexible pumping schedules before sizing the array.
- Commercial solar specifiers: benchmark floating options against ground-mount and rooftop alternatives on a levelised cost basis, remembering that the thermodynamic uplift is modest in the UK and that interconnection speed may be the real differentiator.
- Hydraulic structural engineers: design mooring for the combined wind, wave and level range, check fatigue of float couplings, and verify embankment and bed stability for anchor loads.
- Infrastructure funds: underwrite on offtaker credit, long-term power purchase terms, float-material degradation data and operations contracts, and treat unproven marine and canal formats as technology-risk exposures.
12. Conclusion
The popular image of floating solar, panels on canals and over fish farms, does not match the economics or the physics of the British water estate. Canals are narrow, shaded and navigated, and sea lochs impose wave loads roughly thirty times greater than those on an inland reservoir. The thermodynamic benefit of water cooling is real but modest in a temperate climate, and the headline 10 to 12 per cent peak-summer uplift should be read as an upper bound for the hottest hours rather than an annual expectation.
What makes the format work in Britain is a different combination: stationary, managed water, no navigation conflict, water-quality co-benefits, and a large adjacent electrical load that allows the array to connect behind the meter and avoid the grid queue. On those terms, the reservoir at Walton-on-Thames and the proposed dock at Barrow represent the template. Investors and specifiers who evaluate floating solar as a land-sparing, load-matched, interconnection-advantaged asset, rather than as a cooling gimmick, will reach more reliable conclusions.