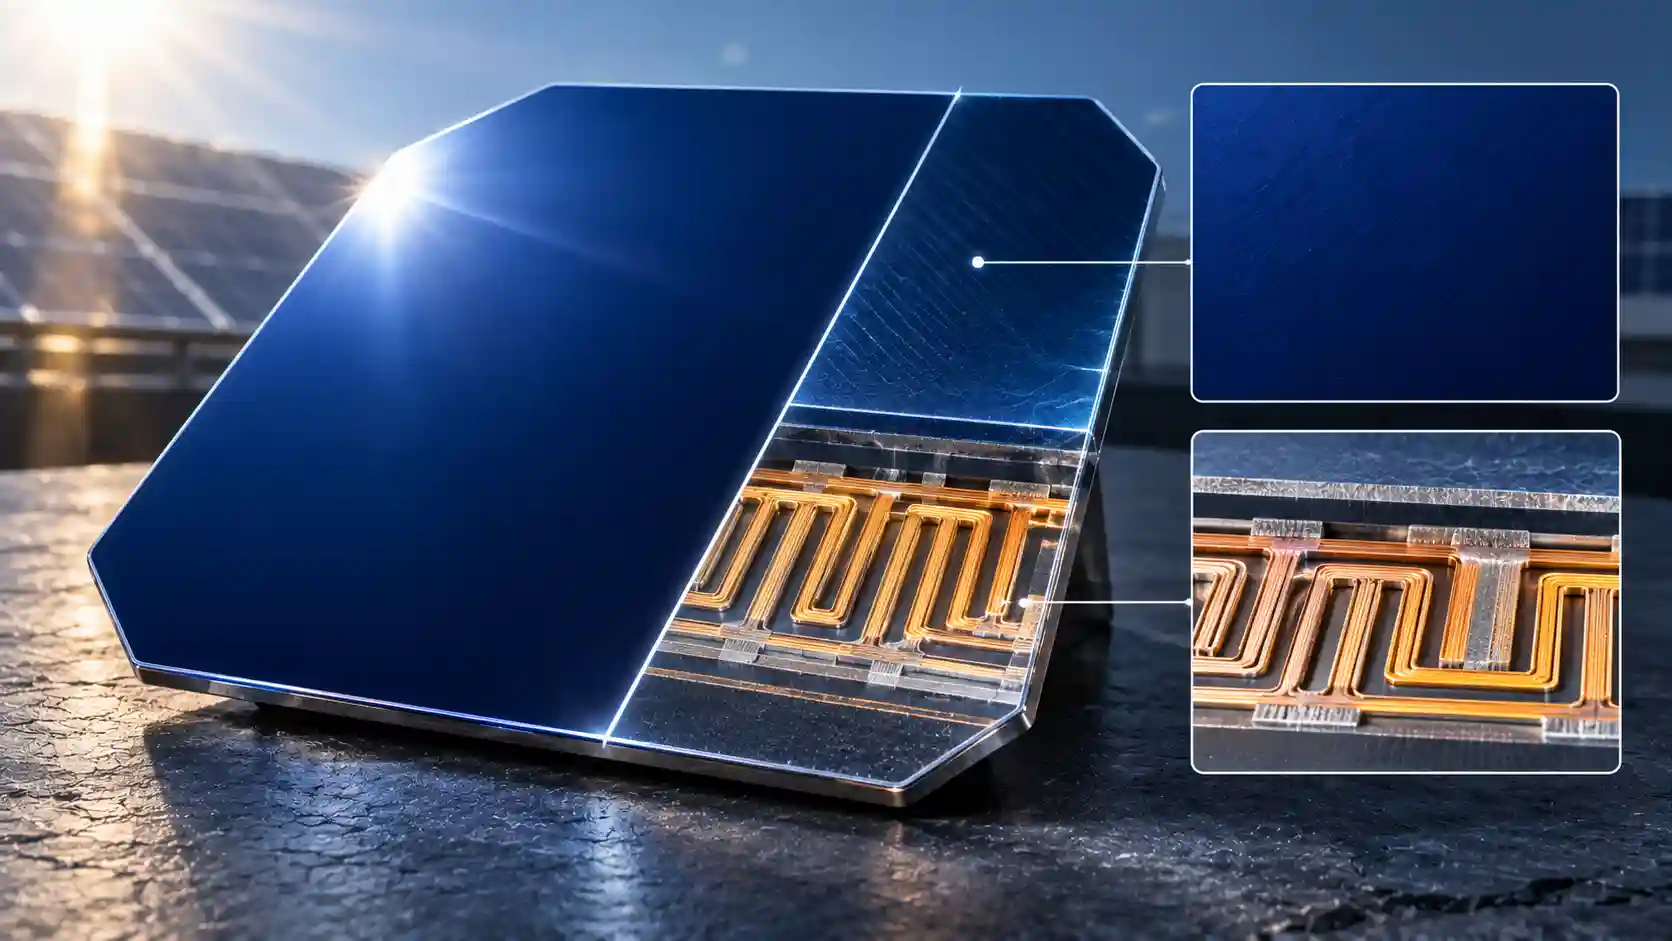
Back-contact photovoltaics are frequently marketed as a cosmetic upgrade, a panel that simply looks cleaner on the roof. That framing understates the engineering. Moving every metal contact to the rear surface of the wafer changes the optical budget, the carrier transport problem, the thermal behaviour and the failure statistics of the cell, and it does so at the cost of a markedly more demanding manufacturing process. This article audits the architecture from the semiconductor physics upwards, for solar system architects, commercial specifiers, residential micro-generation engineers and clean-energy investors. Where numerical examples are given, they are standardised calculations using representative parameters for n-type monocrystalline silicon at 25 degrees Celsius and AM1.5G illumination; they characterise the physics and the orders of magnitude, and they are not substitutes for manufacturer datasheets or independent test reports.
1. The Optical Argument: Eliminating Front-Side Metallisation
A conventional front-contact cell, whether passivated emitter and rear cell (PERC) or tunnel oxide passivated contact (TOPCon), carries a grid of silver fingers and busbars on the sun-facing surface. The fingers are typically 20 to 35 micrometres wide at a pitch of around 1 to 1.8 millimetres, joined by a set of busbars or, in newer designs, by multi-busbar or busbarless wire interconnection. Together, the metallisation and the interconnecting ribbons or wires cover approximately 2.5 to 5 per cent of the cell area at the module level. Light incident on that metal is reflected or absorbed and generates no current, so the loss is a direct subtraction from short-circuit current density (Jsc).
Increasing finger width or density reduces series resistance but increases shading, so front-contact design is a compromise. The optimum balances resistive loss, which scales with the square of current flowing along the finger, against optical loss, which scales with metal coverage. Modern screen-printing, finer fingers and the wire-based interconnection of multi-busbar modules have pushed the combined penalty down, but they cannot remove it.
In an interdigitated back contact (IBC) cell, both polarities of contact are placed on the rear. The front surface carries only an anti-reflection and passivation stack, typically silicon nitride over a thin oxide or aluminium oxide, together with a random-pyramid texture. The geometric shading factor is therefore zero. For a front-contact cell with 3 to 4 per cent shading, that recovers around 3 to 4 per cent in relative Jsc. The claimed range of 3 to 5 per cent of avoided optical loss is consistent with this arithmetic when the interconnect ribbons are included, although it narrows as front-contact designs move to thinner wires and finer fingers.
Consider representative values. An IBC cell with an open-circuit voltage (Voc) of 0.735 V, a Jsc of 41.5 mA/cm² and a fill factor (FF) of 0.84 gives a power density of 0.735 × 41.5 × 0.84 = 25.6 mW/cm² under 100 mW/cm² of illumination, or 25.6 per cent efficiency. A TOPCon cell in the same wafer class might achieve 0.725 V, 40.3 mA/cm² and 0.835, equal to 24.4 per cent. The difference arises from three sources: roughly 1.2 mA/cm² of recovered current from the absence of shading, a modest voltage gain from low-recombination contact schemes, and a higher fill factor from the wide, low-resistance rear metal. Mass-production cell efficiencies for IBC have therefore been reported in the 24 to 26 per cent range, and laboratory and pilot back-contact devices using heterojunction contacts have been demonstrated above 27 per cent.
A second optical benefit is aesthetic and practical. With no visible grid, the module appears uniformly dark, which has value in residential markets where roof appearance matters, and it reduces the visual contrast that affects planning decisions in conservation areas. This should not be confused with performance. The principal performance advantage remains in the cell physics.
2. Rear-Side Carrier Collection: The Core Physics
In a front-contact cell, photons are absorbed within the first few micrometres to tens of micrometres of the wafer and the minority carriers generated there diffuse to a junction located near the front surface. In a back-contact cell the junction is on the rear, so carriers generated near the front must travel essentially the whole thickness of the wafer, 120 to 160 micrometres in current production, before they can be collected. This is the central engineering requirement of the architecture: the carrier diffusion length must be much greater than the wafer thickness.
The diffusion length is L = sqrt(D × tau), where D is the minority carrier diffusion coefficient and tau the effective lifetime. In n-type silicon the minority carriers are holes, with a mobility of around 450 cm²/Vs at moderate doping, giving D = (kT/q) × mobility = 0.0259 × 450, or about 11.6 cm²/s at room temperature. A bulk lifetime of 3 milliseconds therefore yields L = sqrt(11.6 × 0.003) = 0.187 cm, or 1.87 millimetres, roughly twelve times the wafer thickness. That ratio is what permits efficient collection from the far side.
Bulk lifetime depends on the crystal quality of the wafer. N-type Czochralski silicon is preferred because it avoids the boron-oxygen complex that causes light-induced degradation in boron-doped p-type material, and because it is less sensitive to common metallic impurities such as iron, which in p-type silicon forms recombination-active iron-boron pairs. Bulk lifetimes in high-quality n-type wafers reach several milliseconds, approaching the intrinsic limit set by Auger recombination, which for 1 ohm-centimetre material is of the order of 10 milliseconds at low injection. Oxygen precipitates, dislocations, grain boundaries and metallic contamination all reduce the lifetime, so wafer specification is much stricter for back-contact than for conventional production.
The effective lifetime that a carrier experiences combines bulk and surface recombination. For a wafer of thickness W with equal surface recombination velocity S on both surfaces and S small enough that the carrier distribution is uniform through the thickness, 1/tau_eff = 1/tau_bulk + 2S/W. For W = 150 micrometres (0.015 cm) and a well-passivated front surface of S = 5 cm/s, the surface term is 2 × 5 / 0.015 = 667 per second, equivalent to a surface-limited lifetime of 1.5 milliseconds. The effective lifetime is then 1 / (1/3 ms + 1/1.5 ms) = 1.0 millisecond, and L is still about 1.08 millimetres. If passivation is poor, say S = 100 cm/s, the surface term is 13,333 per second, the surface-limited lifetime drops to 75 microseconds and the effective diffusion length becomes only about 0.3 millimetres, only about twice the wafer thickness. A significant fraction of carriers generated near the front would then recombine before collection, and the cell’s short-circuit current and open-circuit voltage would both fall. Front-surface passivation of S below about 10 cm/s is accordingly a design requirement, not a refinement.
The open-circuit voltage links these quantities. Voc = (kT/q) × ln(Jsc/J0 + 1), where J0 is the total saturation current density summing bulk, surface and contact recombination. For Voc = 0.735 V and Jsc = 41.5 mA/cm², the thermal voltage of 25.85 mV gives an exponent of 28.4, so J0 = 41.5 × 10⁻³ / 2.2 × 10¹² ≈ 19 fA/cm². A typical PERC cell with Voc near 0.69 V has a J0 of order 100 fA/cm². Reaching 19 fA/cm² across a cell whose rear surface is a mosaic of metal contacts, diffused regions and passivated gaps demonstrates why every recombination channel must be controlled.
The rear surface itself is structured as alternating strips of emitter (a heavily doped region of opposite polarity to the base) and back surface field (BSF, a heavily doped region of the same polarity), separated by lightly doped or intrinsic gap regions that are passivated. Holes diffusing through the base are swept into the emitter strips by the junction field, while electrons are collected by the BSF strips. Because carriers generated above a BSF strip must travel laterally as well as vertically to reach an emitter, the pitch of the strips is a design parameter: a coarse pitch lengthens the lateral path and adds a resistive and recombination penalty known as electrical shading, while a fine pitch increases the number of patterning boundaries and the manufacturing difficulty. Emitter coverage of 70 to 80 per cent of the rear area, with pitches of around 0.5 to 1.5 millimetres, is typical, so that most carriers need only a short lateral excursion.
A back-contact cell also relaxes a classical trade-off in front-contact designs. In a conventional cell the front emitter must be thin and lightly doped to avoid parasitic absorption and Auger recombination, which raises sheet resistance and demands more metal. In the IBC cell the emitter and BSF are on the rear and can be doped heavily, widened and covered with thick, wide metal, which reduces series resistance without any optical penalty. This is a principal reason that IBC cells achieve high fill factors.
3. Front-Surface Passivation and the Front-Surface Field
The front surface of an IBC cell carries no contacts, which means it can be optimised exclusively for passivation and optics. A typical stack comprises a thin thermally grown or chemically grown silicon dioxide, a lightly phosphorus-doped front-surface field (FSF) or a floating emitter that repels minority carriers from the surface through a built-in electric field, and a hydrogen-rich silicon nitride layer that provides both anti-reflection coating and further chemical passivation of dangling bonds. The combination reduces the front-side J0 to single-digit femtoamperes per square centimetre in the best cases.
The anti-reflection design uses the nitride layer thickness of about 70 to 80 nanometres at a refractive index of around 2.0 to 2.1 to minimise reflectance near the 600 nanometre spectral peak, with random-pyramid texturing that traps light through multiple reflections. Because there is no metal grid to accommodate, texture and coating uniformity can be optimised across the entire area. The passivation must remain stable throughout 25 to 30 years of ultraviolet exposure, damp heat and thermal cycling, and ultraviolet-induced degradation of nitride and oxide passivation is one of the failure modes that module certification is designed to screen.
4. Manufacturing Complexity: From PERC to IBC and HBC
The challenge of back-contact production is that the rear surface must be patterned into interleaved regions of opposite doping polarity with tolerances of tens of micrometres, over millions of cells, at a cost per watt that competes with conventional processes.
A standard PERC process requires roughly eight to ten principal steps: texturing, phosphorus diffusion for the front emitter, selective emitter laser doping, removal of phosphosilicate glass and rear polishing, rear dielectric deposition (aluminium oxide and silicon nitride), front nitride deposition, laser opening of the rear passivation, screen printing of silver and aluminium and finally high-temperature firing. All of these are global, mask-free steps except for the laser opening and the print, and the only alignment-critical operation is the registration of the rear aluminium print to the laser openings and of the front fingers to the selective emitter, with tolerances of order 50 to 100 micrometres.
An IBC process adds multiple patterning stages. Both a boron-doped region and a phosphorus-doped region must be formed in the same rear surface in interleaved patterns, which typically involves deposition of a doping source or a barrier mask, laser or chemical patterning of that mask, a high-temperature diffusion, removal and repetition for the opposite polarity, followed by passivation, contact opening and metallisation. Depending on the variant, this entails 12 to 20 process steps, including several wet chemical etches, one or more laser ablation or laser doping stages and high-temperature furnace cycles at 900 to 1,000 degrees Celsius. The most demanding aspect is registration: the metal fingers, 100 to 300 micrometres wide at the contact level, must land on the correct doped strip with misalignment below roughly 10 to 20 micrometres, because a contact bridging the gap between emitter and BSF produces a shunt or a localised recombination site. This requires automated optical alignment and, in some processes, a self-aligned design that exploits sequential etching to remove the dependence on mask registration.
Laser doping brings its own challenges. A pulsed laser locally melts the silicon surface beneath a dopant-bearing layer, driving dopant atoms into the melt where they diffuse rapidly before the silicon resolidifies within nanoseconds to microseconds. The process offers precise, mask-free patterning but introduces lattice damage, local stress and potential defect generation in the melt zone, which must be removed or annealed. Pulse energy, wavelength, pulse duration and overlap must be tuned for the dopant depth and the minimum tolerable damage. Throughput at gigawatt scale demands multiple laser heads and tight process control.
Heterojunction back-contact (HBC) cells replace the diffused regions with stacks of thin intrinsic and doped hydrogenated amorphous silicon deposited by plasma-enhanced chemical vapour deposition at temperatures below about 250 degrees Celsius. They preserve the exceptional passivation and high Voc of heterojunction technology (values above 0.74 V), but the interleaved deposition of n-type and p-type amorphous layers requires patterning through shadow masks, lithography or laser ablation, and the alignment requirements and contamination risks are severe. HBC cells therefore tend to be the most capital-intensive and the highest efficiency of the group.
The cost consequence is tangible. Equipment capital expenditure per gigawatt for IBC and HBC lines is substantially higher than for PERC, and yield learning takes years, since a single patterning defect can scrap a cell. Wafer requirements are also more stringent. These factors explain the module price premium, indicatively in the range of 15 to 25 per cent over mainstream front-contact products in the UK market, although the premium has been narrowing as production volumes rise and as TOPCon has absorbed some of the cost of higher-grade n-type wafers.
5. Comparative Matrix: Cell Architectures Side by Side
The following matrix summarises the principal metrics across the architectures commonly encountered in UK procurement. Figures are representative commercial ranges and will vary by product and by year; the capital index is a relative module price per watt with mainstream PERC set to 100, intended for comparison and not for quotation.
| Solar Cell Architecture Type | Front-Surface Shading Factor (%) | Maximum Commercial Cell Efficiency (%) | Temperature Coefficient of Power (%/K) | Primary Micro-Crack Failure Risk | Capital Expenditure Index Baseline |
|---|---|---|---|---|---|
| Mono PERC (p-type, passivated emitter and rear cell) | Approximately 3.5 to 5, from fingers, busbars and ribbons | Approximately 23.0 to 23.5 | -0.34 to -0.36 | Cracks propagating from soldered ribbon and busbar junctions on the front surface, plus light and elevated-temperature induced degradation in p-type material | 100 (baseline) |
| TOPCon (n-type, tunnel oxide passivated contact) | Approximately 3 to 4.5, with multi-busbar and fine-wire designs at the lower end | Approximately 25.0 to 26.0 | -0.29 to -0.32 | Front-side finger and busbar stress, silver paste penetration through the oxide, and wafer breakage at thin-wafer edges | Approximately 100 to 110 |
| Silicon heterojunction (HJT) | Approximately 2.5 to 4, with low-temperature silver paste or copper plating | Approximately 25.0 to 26.0 | -0.24 to -0.27 | Fragility of thin wafers and low-temperature solder or conductive-adhesive joints under thermal cycling; sensitivity to damp heat | Approximately 120 to 140 |
| Interdigitated back contact (IBC), including all-back-contact variants | 0 (no front metal) | Approximately 24.5 to 26.0 | -0.26 to -0.29 | Rear interconnect and solder-pad fatigue, plus cell bow from asymmetric rear metal stress; no front ribbon cracking | Approximately 115 to 125 |
| Heterojunction back contact (HBC) and hybrid passivated back contact | 0 (no front metal) | Approximately 26.0 to 27.0 in leading commercial and pilot products | -0.25 to -0.29 | Rear patterning defects and amorphous-silicon layer damage from handling; rear interconnect fatigue; thin-wafer fragility | Approximately 125 to 145 |
Two observations temper the marketing narrative. First, the temperature coefficient of the best back-contact products is no longer unique: modern n-type TOPCon modules have narrowed the gap, and heterojunction cells often have a better coefficient than IBC. Second, the headline cell efficiency is not the same as the module efficiency; interconnection, inactive area and glass losses reduce a 25 per cent cell to a module of about 22 to 24 per cent, which still leads the market on a per-area basis.
6. Thermal Kinetics and the Power Temperature Coefficient
A solar cell loses power as it warms, almost entirely through a fall in open-circuit voltage. The temperature dependence of Voc follows from the temperature dependence of the intrinsic carrier concentration and so of J0. A standard approximation is dVoc/dT = -(Eg0/q - Voc + gamma × kT/q) / T, where Eg0 is the bandgap extrapolated to zero kelvin (about 1.2 eV for silicon) and gamma is a factor of about 3 that encapsulates the temperature dependence of the recombination parameters.
Evaluated at 300 K for a cell with Voc = 0.735 V, the numerator is 1.2 - 0.735 + 3 × 0.0259 = 0.543 V, so dVoc/dT = -1.81 mV/K, or -0.246 per cent per kelvin of the Voc itself. For a PERC cell with Voc = 0.65 V under operating conditions, the numerator is 0.628 V, so dVoc/dT = -2.09 mV/K, or -0.32 per cent per kelvin. The higher the starting Voc, the smaller the relative temperature sensitivity, because the fixed bandgap term represents a smaller fraction of the total. This is the thermodynamic reason that high-voltage architectures, including heterojunction and back-contact cells with excellent surface passivation, display better temperature coefficients. The current term works in the opposite direction, rising by about +0.04 to +0.06 per cent per kelvin as the bandgap narrows and extends the absorption edge, and the fill factor falls by about 0.1 per cent per kelvin as series resistance and recombination change. The sum gives power coefficients in the range of -0.26 to -0.29 per cent per kelvin for leading back-contact modules.
The effect on energy yield depends on the operating temperature, which depends on irradiance, ambient temperature, wind and mounting. Modules in the UK on a pitched roof with limited rear ventilation often operate 20 to 30 kelvin above ambient under strong sun. At an irradiance of 1,000 W/m², a cell temperature of 55 degrees means 30 kelvin above the 25-degree rating condition. A module with a coefficient of -0.29 per cent per kelvin loses 8.7 per cent of rated power, against 10.5 per cent for a module at -0.35 per cent per kelvin, a difference of 1.8 percentage points at that moment. Averaged over a UK year, in which most of the energy is produced at moderate irradiance and cooler cell temperatures, the benefit is much smaller, usually of the order of 0.5 to 1 per cent of annual energy. The advantage is real, but modest, and it is greater in hot climates or on roofs with poor ventilation, such as building-integrated installations.
Hotspot behaviour is a separate issue. When a cell is shaded or defective, it can become reverse-biased and dissipate the power produced by the rest of its string as heat. In a conventional module, bypass diodes across substrings of 20 to 24 cells limit the effect. Back-contact cells typically have a higher reverse-breakdown voltage in their nominal design, and the rear-side placement of the junction can make breakdown more uniform across the area, which lessens local current crowding. Many back-contact modules also use cell-level or half-cell string layouts, for example three bypass diodes with stringing arranged so that a shaded corner takes out a smaller proportion of the module. Shading tolerance is a function of module wiring as much as of cell design, so installers should evaluate the layout rather than relying on the cell type alone.
7. Structural Fatigue and Micro-Crack Mechanics
Photovoltaic modules experience daily thermal cycling over a range of typically 40 to 60 kelvin on a UK roof, and annual cycles from sub-zero winter nights to summer afternoons. The differential thermal expansion between silicon (about 2.6 parts per million per kelvin), copper ribbon (about 17 ppm/K), solder and glass (about 9 ppm/K) imposes cyclic shear and bending stresses on the cell and interconnects. Over tens of thousands of cycles over 25 years, these stresses nucleate and propagate micro-cracks in the silicon, particularly adjacent to ribbon solder joints where the stress concentration is greatest, and cause fatigue in the solder and copper itself.
In a front-contact module, ribbons run across the face of each cell and are soldered at multiple points along busbars. A copper ribbon of 1 millimetre width across a cell of 166 millimetres expands relative to the silicon by about 14 ppm/K × 40 K × 166 mm ≈ 93 micrometres over a daily cycle, which must be accommodated by elastic deformation of the ribbon and solder joint. Multi-busbar designs, with 9 to 16 thin round wires, reduce the stress per joint by sharing the load, but they do not eliminate it.
Back-contact modules can shift this stress state. Because the interconnects are all on the rear, there are no front-side ribbons expanding across the active face, and the front surface is a uniform dielectric stack, free of metal-induced stress concentrators. The cell front remains unstressed by solder cooling. The result is a lower density of stress-induced micro-cracks emanating from front busbars, and a more uniform failure distribution. Some designs also use a patterned conductive backsheet or conductive adhesive in place of soldered ribbons, further reducing peak stress. Manufacturers with strain-relief copper structures on the rear of the cell argue that these provide flexibility to absorb thermal expansion.
The rear contacts introduce their own concerns. The rear metal is typically a thick, wide layer, and the asymmetry of metal stress between the front and rear faces can induce cell bow, which complicates lamination and can pre-stress cells. Rear solder pads or adhesive bonds still experience thermal cycling fatigue. Rear-contact patterning raises the risk that a micro-crack passing through a doped strip could disconnect part of the cell, although the multiple parallel strips mean the loss is usually partial. Overall, field data and accelerated testing on mature back-contact products have supported strong long-term degradation figures, of the order of 0.25 to 0.5 per cent per year, but the dataset for newer, thinner-wafer products is shorter, and an investor should prefer independent test data such as extended thermal cycling, damp heat and mechanical load tests beyond the baseline certification requirements.
8. Yield Economics for Space-Constrained Roofs
The economics of back-contact modules rest on area. A typical UK domestic roof has a finite south, east or west-facing area unobstructed by dormers, chimneys and rooflights. When area is the binding constraint, the figure that matters is the kilowatt peak per square metre, because it sets the achievable system size, and with it the annual generation.
Consider a roof of 30 square metres of usable area. With a 21 per cent efficient module (about 210 W/m²) and allowing for module spacing, the array would deliver around 6.3 kWp. With a 23.5 per cent efficient module (about 235 W/m²) the array becomes 7.05 kWp. At a UK specific yield of 900 kWh per kWp per year, the annual generation rises from 5,670 kWh to 6,345 kWh, an increase of 675 kWh. At an export rate of 15p/kWh, the value is about £100 per year, and at a self-consumption value of 25p/kWh it can approach £170. Taken over 25 years, with degradation of 0.4 per cent per year, the extra generation is worth around £2,000 to £3,500 undiscounted. A module premium of 20 per cent on a 7 kWp system, at perhaps £0.20 per watt of module cost, is about £280 more on module cost alone, which comfortably pays back where area is limited.
Where roof area is abundant, as on large commercial buildings, ground-mount sites and agricultural roofs, the picture reverses. Cost per watt dominates, and the lower module price of mainstream n-type TOPCon often prevails, because the system cost is driven by mounting, cabling and inverter capacity per kilowatt, and the area saved offers no advantage. For commercial specifiers, the choice should be run through a levelised cost of energy comparison with site-specific yield and balance-of-system costs rather than assumed from efficiency alone. Venture investors should note that the market segment where back-contact has structural advantage, premium residential and constrained rooftops, is substantial but limited relative to utility-scale demand.
9. The UK Supply Chain and Procurement Map
The UK solar market is characterised by a three-tier route to market. Manufacturers and their regional offices or importers sit at the top, supplying a layer of national and regional wholesale distributors, who hold stock at depots and ship by pallet to a long tail of installers through trade counters, delivery services and online trade portals. Installers, who hold certification under the Microgeneration Certification Scheme (MCS), then sell to domestic and commercial end customers. The Smart Export Guarantee requires installation by an MCS-certified installer using MCS-certified products for export payments to be available from suppliers, which makes the certification status of both installer and product a procurement constraint.
Back-contact products reach this system by different routes depending on the manufacturer:
- Maxeon: an established IBC specialist with a long history in the premium residential segment, whose modules have been sold in the UK through national distributors and a network of approved installers. The company has been through financial restructuring in recent years, so buyers should treat manufacturer financial standing as a due-diligence item when relying on long-term warranties.
- Aiko: a Chinese manufacturer that has built a market position around its all-back-contact (ABC) technology, launching several module families with rated efficiencies above 23 per cent. Its UK presence has grown through distribution agreements, and its products are marketed to installers as a premium residential option.
- LONGi: a very large manufacturer whose back-contact line, based on a hybrid passivated back contact (HPBC) cell design, has been introduced alongside its mainstream products. As LONGi has established distributor relationships in the UK, its back-contact modules are generally available through the same channels as its conventional range.
Because stock, distributor appointments and product listings change frequently, specifiers should verify current availability, lead times and pricing directly with UK distributors and manufacturer technical sales teams before design freeze. Checklist items for procurement include whether the specific module model appears in the MCS product directory, the certified power rating and the dimensions as listed, the warranty terms and the identity of the UK warranty provider, the pallet quantity and delivery lead time, and the minimum order quantity for the model.
Warranty parameters should be read closely. Product (materials and workmanship) warranties for premium modules typically run for 15 to 25 years, with some manufacturers offering up to 40 years on selected products, while linear performance warranties commonly guarantee 87 to 92 per cent of nameplate power at year 25 to 30, with first-year degradation of around 1 to 2 per cent. Important differences include whether the warranty covers labour and removal costs for replacement, whether claims are administered through a UK entity, whether the warranty is backed by insurance and whether it is transferable on sale of the property. A manufacturer’s warranty is only as strong as its balance sheet, which is why some installers add insurance-backed warranty schemes.
Other procurement considerations include supply chain due diligence, since UK buyers increasingly face expectations for traceability of polysilicon and wafer origin, and compatibility with inverters and optimisers. Back-contact modules usually have module voltages and currents within the normal range, but the higher current per cell at a given size can affect string sizing and optimiser choice, so electrical designs must be checked against datasheet values at the lowest expected temperature.
10. Design Guidance by Application
- Space-constrained residential roofs: the strongest case for back-contact. Compare kWp per usable square metre across candidate modules and run a lifetime value comparison using the site’s own export and self-consumption values.
- Roofs with partial shading: evaluate string layout, bypass diode arrangement and optimiser or microinverter options. Module-level power electronics can recover value in shade irrespective of cell type.
- Large commercial roofs and ground-mount sites: compare on levelised cost of energy. Cost per watt and balance-of-system savings usually favour mainstream n-type TOPCon unless area or structural load is constrained.
- Hot or poorly ventilated installations: the temperature coefficient advantage matters more; building-integrated and low-clearance installations can justify a premium module.
- Aesthetic or planning-sensitive buildings: the uniform black appearance of all-black back-contact modules may carry value that is not captured by the energy yield alone.
11. Risks and Open Questions for Investors and Specifiers
Several risks deserve attention. The first is technology convergence: TOPCon has improved quickly and continues to close the efficiency and temperature-coefficient gap, while back-contact variants of TOPCon and heterojunction cells are emerging, which blurs the categories and may compress the premium. The second is manufacturing yield and cost learning: the complexity of the process means that producers must reduce patterning steps and silver consumption to reach cost parity, and those that fail will find the premium unsustainable. The third is intellectual property, as back-contact processes are heavily patented and litigation between manufacturers has occurred; a supplier’s freedom to operate in the UK market is a legitimate diligence question. The fourth is long-term reliability data for thinner wafers and new interconnect schemes. The fifth is supply-side concentration, since almost all of the world’s wafer and cell capacity sits in a single country, and trade policy and sanctions can influence pricing and availability.
12. Conclusion
Back-contact architecture is a genuine advance in cell design rather than a cosmetic variant. It converts the unavoidable compromise between metal coverage and series resistance into an advantage, by moving the metal to the rear where it can be as thick and wide as needed. The physics demands exceptional wafer quality, with minority carrier diffusion lengths of a millimetre or more, and front-surface passivation delivering recombination velocities of single digits, and the manufacturing process demands micrometre-level patterning of doped regions over the full wafer. Where these requirements are met, the result is a cell that is 1 to 2 absolute percentage points more efficient than mainstream TOPCon, with a modest additional yield advantage from its temperature behaviour and potentially reduced front-side mechanical fatigue.
The decision to specify it should therefore be framed as an area and lifecycle problem. Where the roof is small, shaded, hot or visible, the extra power density and uniform appearance can justify a premium of 15 to 25 per cent. Where space is abundant and cost per watt dominates, mainstream n-type products remain the efficient choice. In every case, specifiers should verify MCS status, warranty structure and distributor stock directly, and base decisions on independent test data and the financial standing of the supplier.