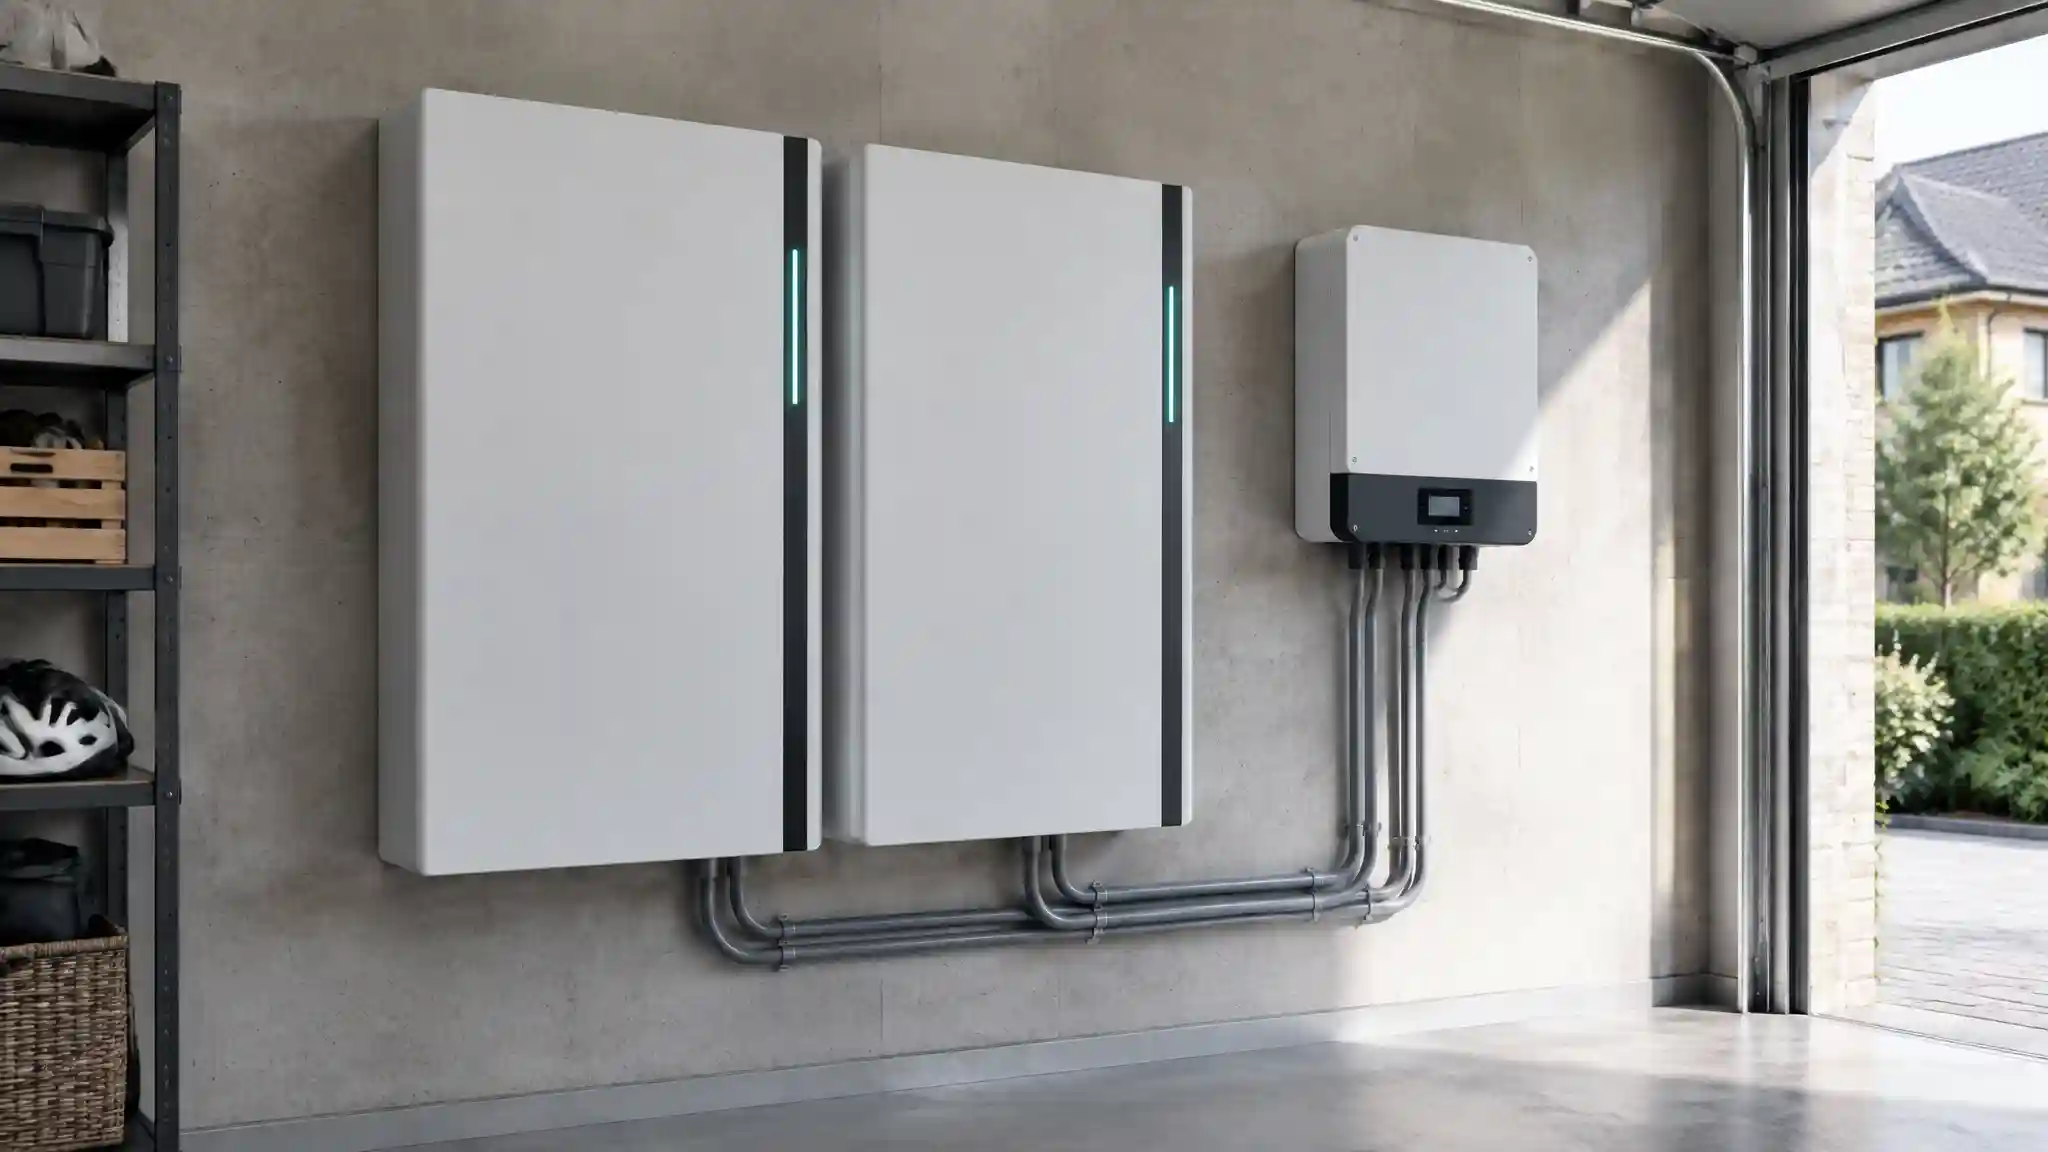
A domestic solar battery is sold on a headline that is easy to repeat and hard to verify: ten years, six thousand cycles, 70 per cent or 80 per cent of capacity retained. Those figures are warranty constructs, drawn up by legal and actuarial teams against assumed duty cycles and temperatures. The physical lifespan of the same battery is determined by electrochemistry, and specifically by a small number of parasitic reactions that consume the lithium inventory and thicken the interfaces inside each cell. This article characterises those mechanisms in lithium iron phosphate (LFP) cells, compares high-voltage series stacks with 48 V low-voltage parallel architectures, and sets out the operating rules that defend the cells for as long as the chemistry allows. It is written for solar microgrid specifiers, domestic energy consultants and system integration engineers who need to move from catalogue claims to defensible lifecycle models.
Why LFP Changed the Baseline
Early domestic storage used nickel manganese cobalt (NMC) cells, whose layered oxide cathodes offer high energy density but are structurally stressed by repeated lithium insertion and extraction, and whose thermal stability margins are narrower. LFP uses an olivine-structured iron phosphate cathode. The strong phosphorus-oxygen covalent bonds hold oxygen tightly in the lattice, so the cathode is mechanically and thermally robust, with a very flat voltage plateau around 3.2 V nominal and a usable window of roughly 2.5 V to 3.65 V per cell. The cathode itself degrades slowly: it is largely free of the transition-metal dissolution and oxygen release that damage NMC. The consequence is that, in LFP cells, the dominant ageing mechanisms move away from the cathode and towards the anode interface, where the electrolyte is chemically reduced against the graphite.
The result is a substantial improvement in cycle life. Well-designed LFP cells are routinely tested to several thousand full equivalent cycles before reaching 80 per cent State of Health (SoH), and the best prismatic cells, cycled gently at moderate temperatures, report figures exceeding six thousand. State of Health here means the ratio of present usable capacity to initial rated capacity. The figure is an outcome of the operating conditions, not an intrinsic property of the chemistry, which is why two identical batteries installed in different homes can age at markedly different rates.
The Microscopic Mechanism: SEI Growth on the Graphite Anode
Although the cathode is LFP, the anode in almost all commercial cells is graphite. Graphite operates at about 0.1 V above lithium metal when charged, which lies outside the electrochemical stability window of conventional carbonate electrolytes. During the first charge cycles the electrolyte solvents and salts decompose on the graphite surface, and the products form a thin, ionically conductive but electronically insulating layer known as the solid electrolyte interphase (SEI). This initial layer is beneficial: once formed, it passivates the surface and prevents further electrolyte reduction while still allowing lithium ions to pass.
The problem is that the SEI is never perfectly stable. Graphite particles expand by roughly ten per cent in volume as lithium intercalates, and contract as it leaves. This repeated breathing cracks and exposes fresh graphite, and each exposed patch immediately consumes electrolyte and lithium to rebuild the layer. The SEI therefore thickens over time. Every lithium ion incorporated into the SEI is permanently removed from the circulating inventory: it can no longer shuttle between cathode and anode to carry charge. Because LFP cells are typically built with a limited lithium inventory, relative to the capacity of the electrodes, this loss of lithium inventory (LLI) translates almost one for one into lost capacity.
Thickening has a second effect. A thicker SEI is a more resistive one, so the cell's internal resistance rises. Higher resistance produces more heat for a given current, lowers the voltage available under load, and can limit the power the battery can supply in the final stages of ageing. The two phenomena, capacity fade from LLI and power fade from resistance growth, are closely linked and typically proceed in parallel. In more severe cases, particularly at low temperature or high charge current, lithium can plate as metal on the anode surface rather than intercalating into the graphite. Plated lithium is partially irreversible and consumes still more inventory, and it can grow dendritically in ways that compromise safety. Domestic systems rarely charge fast enough to plate under normal conditions, but cold-climate garages and unheated outbuildings can approach the threshold, which is why low-temperature charging limits are a safety function and not merely a performance consideration.
Calendar Ageing versus Cycle Ageing
Degradation divides into two categories. Cycle ageing is the loss associated with charging and discharging: the mechanical stress of particle expansion, the cracking and repair of the SEI, and the heat generated by resistive losses. Calendar ageing is the loss that accrues with time, even when the battery is idle. It is driven by the continuing slow reaction between the anode and the electrolyte, and it is governed by two variables above all: temperature and State of Charge (SoC).
Temperature acts through the Arrhenius relationship. The rate of most chemical reactions approximately doubles for each 10 K rise in temperature, and the parasitic reactions that grow the SEI are no exception. A battery held at 35°C ages materially faster than one held at 20°C, and a unit mounted on a sun-facing wall in a poorly ventilated enclosure may spend long periods well above the cells' comfort zone. The relationship is also compounding, since resistive heating adds to ambient heat when the system works hard on hot days.
State of Charge matters because it sets the anode potential. At high SoC the graphite is highly lithiated and its potential is closest to lithium metal, which maximises the driving force for electrolyte reduction. At high cell voltage, which in LFP corresponds to the final few per cent of charge as the flat plateau gives way to a steep rise towards 3.65 V, the electrochemical stress is greatest. A battery held at 100 per cent SoC, for instance one that fills by mid-morning on a summer day and sits full under a hot sun until the evening, experiences the worst combination of high anode potential and high temperature. In this sense, the common pattern of a south-facing system that is saturated for six or more hours per day is the textbook degradation trap.
A common misconception is that LFP's flat voltage curve makes it immune to this effect. The flatness actually makes SoC harder to estimate from voltage alone, which complicates control, but it does not alter the underlying kinetics at the graphite interface. Storage at mid-range SoC, roughly 40 to 60 per cent, minimises calendar ageing. Operation between about 20 and 90 per cent SoC avoids both the steep voltage regions and the lowest anode potentials, and typically extends life by a meaningful margin at the cost of some usable capacity. This is a direct trade-off between day-one usable kilowatt-hours and long-run asset value, and it deserves a deliberate modelling decision, not a default setting.
High-Voltage Series versus 48 V Low-Voltage Parallel Architectures
The voltage topology of the battery stack influences both efficiency and ageing, and the market is split between two broad designs. Low-voltage (LV) systems use a nominal 48 V to 51.2 V string, usually sixteen LFP cells in series (16S), with multiple modules connected in parallel to increase capacity. High-voltage (HV) systems stack many more cells in series, with packs commonly operating from around 100 V up to 400 V or beyond, and grow capacity by adding modules in series to a common high-voltage bus.
The first trade-off is current and resistive loss. For a given power, current is inversely proportional to voltage (P = V × I). A 5 kW load on a 48 V bus draws roughly 100 A, whereas the same load on a 400 V bus draws about 12.5 A. Resistive heating in conductors, busbars, connectors and fuses scales with the square of current (I²R), so the HV system dissipates about sixty times less heat in the same conductor resistance. In practice the cabling is sized differently and the ratio is smaller, but the principle holds: HV systems suffer lower conduction losses, can use lighter cabling, and typically need fewer power conversion stages when paired with a high-voltage hybrid inverter, because the inverter's DC input is already close to the voltage it needs. These factors support round-trip efficiencies in the mid-90s per cent range for good HV systems, compared with low-90s for typical LV systems, although the inverter and not the cells is usually the dominant source of loss.
The second trade-off is the behaviour of parallel strings. In an LV architecture with several modules in parallel, each module has slightly different internal resistance, state of charge and temperature, and the modules share current accordingly. The module with the lowest resistance takes the largest share and ages faster, creating a feedback loop: its resistance falls relative to the others as the others age, or rises as it ages, depending on the mechanism, and the imbalance may either self-correct or diverge. Cables of unequal length between modules aggravate the problem, since an extra half-metre of cable can alter the current split noticeably at high currents. Standardised practice therefore includes equal-length, equal-gauge interconnects, a common busbar, and careful matching of module age when expanding a system. Mixing old and new modules in a parallel LV array is a recognised source of accelerated degradation.
HV series stacks avoid the current-sharing problem, because the same current flows through every cell in the string. The corresponding risk is that the string is only as strong as its weakest cell. The weakest cell, whether lowest in capacity, highest in resistance or hottest, reaches its voltage limits first, and the battery management system (BMS) must stop charging or discharging the entire string at that point. A single poor cell among over a hundred therefore constrains the usable capacity of the whole stack, and any cell that is repeatedly driven to a high voltage limit will degrade preferentially. This makes the BMS the critical component: it must monitor every cell voltage and temperature, communicate with the inverter in real time, and apply balancing to keep the cell voltages together.
Safety margins also differ. A 48 V system is classified as extra-low voltage and can generally be handled with fewer precautions, though the high currents carry their own fire and arc hazards. A 400 V DC stack is a serious shock and arc-flash hazard, and demands appropriate isolation, DC-rated protection, insulation monitoring and trained installers. Neither topology is inherently superior in longevity. The HV design's advantages in efficiency and heat are real, while the LV design's advantages in modularity, serviceability and lower installation hazard are equally real. What determines the outcome is the quality of the BMS and the thermal design.
Cell Balancing and the Battery Management Handshake
Cells in a series string drift apart over time, because each has slightly different self-discharge, capacity and temperature exposure. Without correction, the spread grows, reducing the usable capacity of the stack and concentrating stress on the outlying cells. Balancing corrects this. Passive balancing bleeds energy from the highest cells through resistors, typically at currents in the tens to low hundreds of milliamps, and occurs only near the top of charge. Active balancing transfers energy between cells using capacitors or inductors and is more efficient, but costs more and adds complexity.
The flat voltage curve of LFP makes balancing particularly sensitive: cell voltages differ very little over most of the SoC range, so the BMS can only distinguish cells reliably near the ends of the charge window, where the voltage rises steeply. If the system is never charged to near-full, the balancing circuit never gets a chance to operate, and imbalance accumulates unseen. This creates a tension with the preference for low maximum SoC, resolved in practice by a scheduled periodic full charge, for example once every week or two, held long enough for balancing to complete, and returned immediately to the normal limit. The BMS also communicates with the inverter via CAN bus or RS485 to impose charge and discharge current limits, and a failed or misconfigured communications handshake typically leaves the inverter running in a conservative fallback mode or, worse, with no protective limits at all. Low-power balancing handshakes of this kind protect individual cells from localised voltage stress, and are a prerequisite for the premature capacity fade avoidance claimed by HV stacks.
Operational Rules for Defending Cell Assets
The preceding analysis translates into a set of practical settings and siting rules. None is exotic, and most cost nothing, but they are rarely applied by default.
- Restrict the maximum charge window. Where the daily energy budget allows, limit the upper SoC to about 90 per cent, or lower in summer. Charging last to the point of need, such as by delaying grid or solar charging until later in the day, reduces the time spent at high voltage.
- Avoid sustained deep discharge. A lower limit of 10 to 20 per cent protects against over-discharge and reduces stress on the cathode and anode at the voltage extremes.
- Manage ambient thermal boundaries. Locate the battery in a space that stays between roughly 10°C and 30°C. Avoid south-facing external walls, loft spaces and unventilated cupboards. Where a battery must live in a hot space, shade, ventilation or active cooling can pay for itself in cycle life.
- Limit charge and discharge rate. Moderate C-rates generate less heat and less mechanical stress. A domestic system sized so that normal operation uses a fraction of the maximum rated power ages more slowly.
- Schedule balancing deliberately. Permit a periodic full charge for cell balancing, then return to the conservative window. Verify that the BMS logs balancing events.
- Respect low-temperature charging limits. Do not override cold-charge inhibits. Lithium plating is cumulative and irreversible.
- Match modules and cabling in parallel systems. Use equal-length interconnects and avoid mixing modules of different age or batch.
- Monitor and log. Track capacity, internal resistance and cell voltage spread over time. A growing spread is the earliest warning of a failing cell.
These rules involve a trade-off against immediate utility. Restricting the charge window to 10 to 90 per cent gives up around a fifth of nominal capacity every day. The sensible way to evaluate this is as an asset-optimisation exercise: compare the lost daily energy value against the extension in lifetime, expressed in additional years of service or cycles delivered. For many households with oversized batteries relative to their consumption, the sacrifice is negligible. For those with tight margins, a more modest restriction may be appropriate.
Interpreting Warranty Claims
Warranty documents deserve careful reading. A guarantee of ten years and a stated throughput in megawatt-hours, or a number of cycles, will usually be conditional on operating temperature, depth of discharge and on the use of approved inverters and firmware. The end-of-warranty threshold is frequently 70 per cent of rated capacity for a given throughput, which is considerably lower than the 80 per cent used for headline cycle-life figures. A cycle count is also ambiguous, since a half-depth cycle may count as a full cycle, or as half, depending on the manufacturer's definition. Comparisons between products from vendors such as BYD, whose Battery-Box range spans both HV and LV variants, should be made on a like-for-like basis of throughput, retained capacity and conditions, not on the headline number alone. Where the warranty depends on connectivity or data logging, ensure that the integration is robust, since a lapse can invalidate a claim.
The Comparative Matrix
The matrix below compares typical topologies. The figures are indicative ranges for LFP systems under moderate domestic operation, and individual products vary. Always confirm values against the manufacturer's datasheet and warranty terms.
| Battery Pack Voltage Topology | Typical Operating Voltage Range | Round-Trip Conversion Efficiency | Dominant Degradation Stress Factors | Expected Cycle Life to 80% SoHealth |
|---|---|---|---|---|
| Low-voltage 48 V, single module (16S) | Approximately 40 V to 58 V | Approximately 90% to 94% | High current heating, high SoC dwell and ambient temperature | Approximately 4,000 to 6,000 cycles under moderate use |
| Low-voltage 48 V, multiple modules in parallel | Approximately 40 V to 58 V | Approximately 90% to 94% | Unequal current sharing, mismatched module age, interconnect resistance and thermal gradients | Approximately 3,500 to 6,000 cycles, with wider spread between modules |
| High-voltage series stack (around 100 V to 200 V) | Approximately 90 V to 230 V | Approximately 93% to 96% | Weakest-cell limiting, balancing quality and high SoC dwell | Approximately 4,000 to 6,000 cycles under moderate use |
| High-voltage series stack (up to 400 V and above) | Approximately 200 V to 450 V | Approximately 94% to 97% | Single-cell voltage stress, BMS handshake reliability and thermal uniformity across a long string | Approximately 4,000 to 6,000 cycles, highly dependent on BMS quality |
Engineering Verdict and Specification Guidance
The evidence points to a conclusion that is less about topology than about operating discipline. LFP chemistry gives the system a long theoretical life, but the practical lifespan is set by the temperature the battery experiences, the proportion of time it spends at high State of Charge, and the quality of its management system. HV series stacks deliver a genuine efficiency advantage and lower conduction losses, but they concentrate risk in the BMS and demand more rigorous installation. LV parallel systems are modular and more forgiving to install, but they require careful attention to current sharing and module matching. For specification, the following checklist is recommended:
- Request the cycle-life test conditions, including temperature, depth of discharge, C-rate and end-of-life criterion, not just the headline figure.
- Read the warranty for conditions, including the SoH threshold, throughput cap, temperature clauses and approved inverter lists.
- Design the thermal environment first, choosing a location that stays cool and ventilated before choosing the product.
- Set a conservative SoC window at commissioning, and review it seasonally against actual consumption.
- Confirm BMS and inverter compatibility, including firmware versions and a tested communications handshake, since a fallback mode can quietly disable protective limits.
- Plan expansions carefully, favouring matched modules and equal-length wiring, and recognising that HV stacks are generally expanded within a defined voltage range.
- Instrument and log, so that capacity fade and cell spread are visible long before a warranty claim becomes necessary.
In summary, the solar battery lifespan equation is not a single number but a function of chemistry, temperature, voltage and control. Specifiers who characterise these variables, localise the thermal design to the site and apply standardised operating limits will routinely extract more years of service from the same cells than those who accept factory defaults. Treated as a managed asset, rather than as a sealed appliance, an LFP battery can deliver a decade or more of useful storage and retain meaningful residual value at the end of its first life.