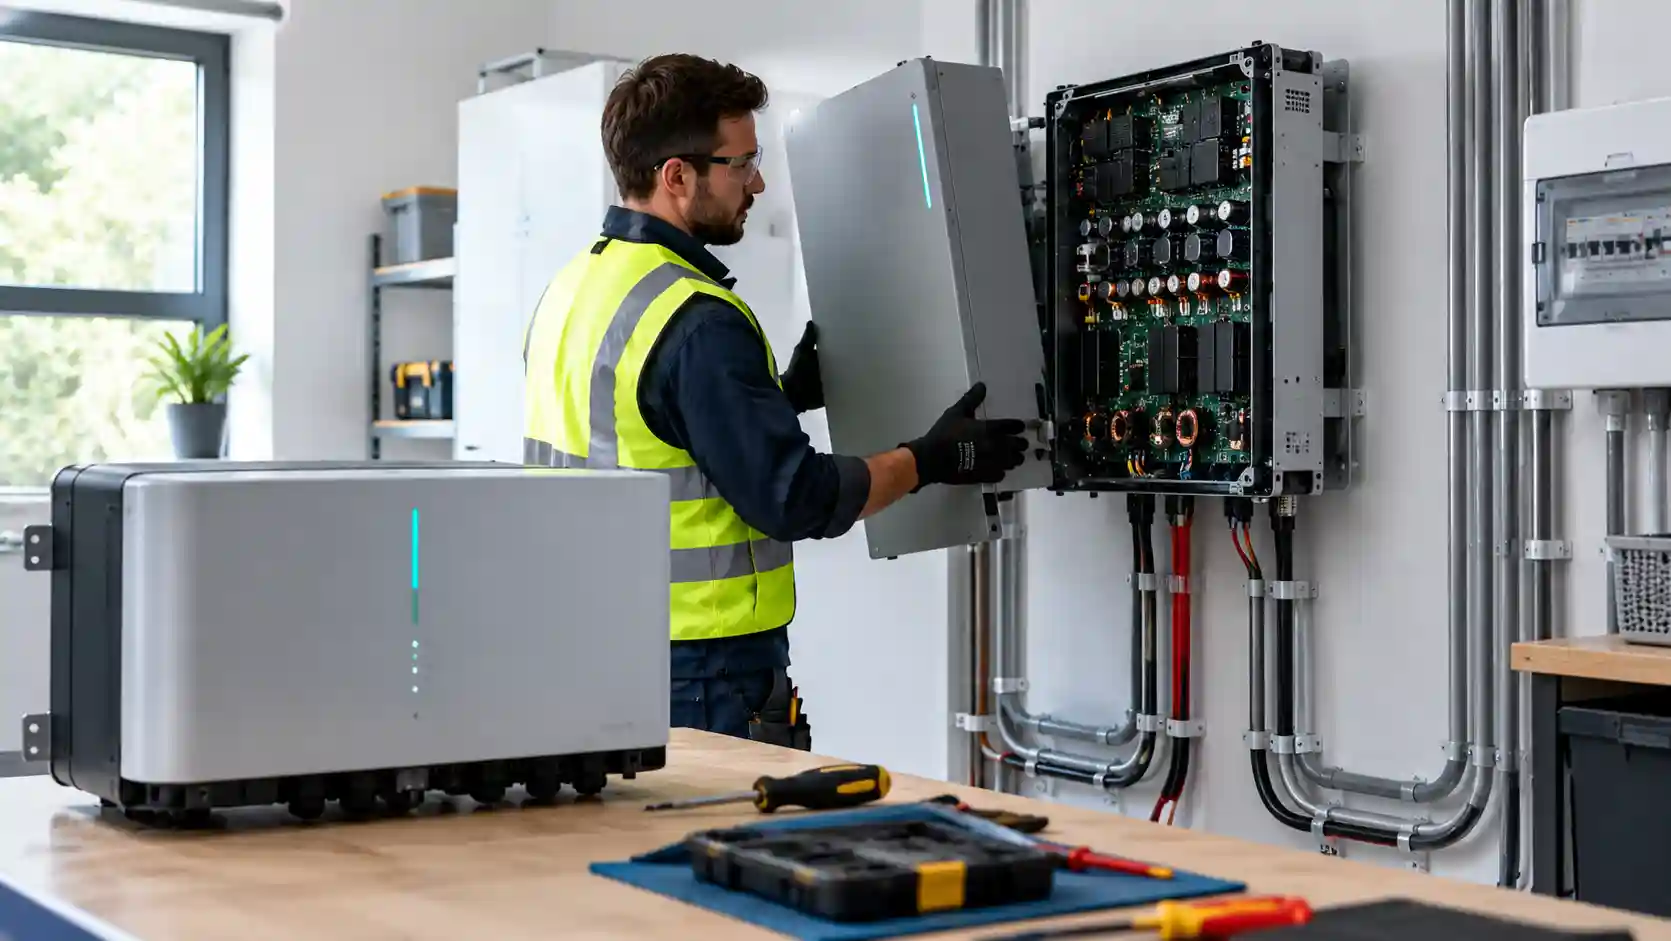
The financial case for domestic solar is usually presented as a single clean line: a capital outlay, an annual saving and a payback date. The assumption buried inside that line is that the system runs unmodified for 25 years. Monocrystalline silicon modules largely justify the assumption, with typical performance warranties guaranteeing around 80 to 87 per cent of nameplate output after 25 to 30 years and field studies showing annual degradation of roughly 0.4 to 0.6 per cent. The inverter that converts their direct current output into grid-synchronised alternating current is a different kind of asset. It is a dense assembly of power semiconductors, magnetics, capacitors, sensors and firmware operating continuously in a hostile thermal environment, and it ages on a timescale of years, not decades.
This analysis treats the inverter as a scheduled capital event. It examines the physics of how inverters fail, compares the failure and cost profile of string and microinverter topologies, and rebuilds the return on investment (ROI) of a representative domestic array with a mid-life replacement included. It is written for solar microgrid specifiers, domestic asset managers and renewable energy financial analysts who need defensible cash flow models, not marketing payback figures.
Deconstructing solid-state inverter failure mechanisms
Where the heat comes from
An inverter has no moving parts, but it is far from passive. Conversion from DC to AC is accomplished by switching semiconductor devices, historically insulated-gate bipolar transistors (IGBTs) and, in most modern residential equipment, metal-oxide-semiconductor field-effect transistors (MOSFETs), including silicon carbide and gallium nitride variants in higher-performance designs. The devices are switched at tens of kilohertz, chopping the DC input into a pulse-width-modulated waveform that is filtered into a sinusoid. Every switching event and every moment of conduction dissipates some energy as heat.
Two loss mechanisms dominate. Conduction loss arises because a MOSFET in its on state has a finite resistance, RDS(on), and dissipates I squared R as current passes through it. Switching loss arises because during each turn-on and turn-off transition the device simultaneously carries current and supports voltage for a few nanoseconds, producing an energy pulse per cycle that, multiplied by the switching frequency, becomes a continuous power loss. Magnetic components add core and winding losses. A well-designed residential inverter reaches peak conversion efficiency of 97 to 98.5 per cent, which means that at 5 kW output it still dissipates 75 to 150 W as heat inside a sealed enclosure, concentrated in a few square centimetres of silicon and a handful of capacitors and inductors.
Electrolytic capacitor ageing
The most common wear-out failure in inverters is the aluminium electrolytic capacitor. These components smooth the DC link voltage and absorb ripple current, and they are used because they offer very high capacitance per unit volume and cost. Their structure is an aluminium foil anode with a thin oxide dielectric, a paper separator soaked in liquid electrolyte, and a cathode foil, wound into a cylinder and sealed with a rubber bung.
The liquid electrolyte is the limiting factor. Over time, electrolyte molecules diffuse through the elastomeric seal and evaporate. The rate is thermally driven and follows the Arrhenius relationship: a rule of thumb used throughout the industry holds that capacitor life halves for every 10 degrees Celsius rise in core temperature. A capacitor rated for 5,000 hours at 105 degrees Celsius could in principle last 160,000 hours at 55 degrees Celsius, but only if the core temperature is held there. Ripple current heats the core internally through the equivalent series resistance (ESR), so the real operating temperature is the ambient temperature inside the enclosure plus self-heating. As electrolyte is lost, capacitance falls and ESR rises, which increases self-heating, which accelerates further evaporation. The process is self-reinforcing and ends in a rapid decline once a critical fraction of electrolyte has gone.
The functional consequences follow in sequence. Reduced capacitance allows greater voltage ripple on the DC link, stressing the semiconductors and degrading the quality of the output waveform. Increased ESR produces more heat. Eventually the inverter trips on DC overvoltage or ripple faults, fails to start, or shows intermittent shutdowns that often first appear on hot afternoons. In many inverters the capacitor bank is the single component that determines overall service life.
MOSFET thermal fatigue
Power semiconductors fail through different mechanisms. The dominant one is thermal cycling fatigue. A solar inverter experiences a daily thermal cycle: cold at dawn, rising as the sun climbs and output increases, falling again at dusk. Seasonal variation adds a larger, slower cycle. Each cycle imposes temperature swings on the silicon die, its solder or sintered attachment, the copper baseplate and the heatsink. These materials have different coefficients of thermal expansion. Silicon expands at about 2.6 parts per million per degree Celsius, copper at 17, aluminium at 23. Each swing therefore induces shear stress at the interfaces.
Over thousands of cycles the stress produces micro-cracks in the solder layer between die and substrate, a process called solder fatigue or die-attach degradation. As the cracks propagate, the thermal path from die to heatsink narrows, raising junction temperature for the same power dissipation. This accelerates further cracking. Wire bonds connecting the die to the package terminals suffer similarly, with heel cracking and eventual lift-off. In the final stage, a failed thermal interface produces local hot spots and thermal runaway, where rising temperature increases RDS(on), which increases dissipation, which raises temperature further, until the device short-circuits or the gate oxide fails.
Additional stressors
Several secondary factors accelerate these primary mechanisms. High DC input voltage on a lightly loaded string, particularly on cold bright mornings when open-circuit voltage is highest, stresses semiconductor blocking capability. Grid transients, including surges from lightning and switching events, can damage input protection and gate drivers. Humidity and condensation inside poorly sealed enclosures cause corrosion and leakage currents. Dust accumulation on heatsinks and fans reduces cooling. Inverters installed in unventilated lofts, south-facing external walls or sun-exposed garages operate at ambient temperatures well above the design reference, reducing capacitor life disproportionately. Fan-cooled designs introduce another wear-out component, as bearings degrade over time.
The bathtub curve and field failure rates
Electronic reliability is conventionally described by a bathtub curve: elevated early failures from manufacturing defects, a long period of low random failure, and a rising wear-out tail. For solar inverters, large field studies and installer data suggest that the useful life of residential string inverters centres on 10 to 15 years, with a meaningful proportion failing between years 8 and 12 and a smaller proportion lasting beyond 15. Manufacturer warranties of 5 to 10 years, often extendable for a fee, reflect the same pattern. A warranty of ten years does not imply a service life of ten years; it is a commercial promise priced against a failure curve whose steepest section may begin shortly afterwards.
String inverters versus microinverters
String inverter architecture
A string inverter is a single wall-mounted unit that receives high-voltage DC from one or more series strings of panels, typically operating between 150 and 600 V DC, and converts it to AC for the household supply. Its advantages are economic and practical. It concentrates power electronics into one place, where it can be easily accessed, monitored and replaced. It is the lowest cost per kilowatt of conversion capacity, and it can be integrated with hybrid battery systems. In many installations it is mounted in a garage, utility room or loft, away from the weather.
The disadvantages are equally structural. A single inverter is a single point of failure: when it fails, the entire array stops generating until the inverter is replaced. A fault in the middle of a sunny summer carries a direct revenue loss, which grows with the time to repair. Series-string layouts also expose the whole string to shading or panel mismatch, although optimisers can mitigate this. The capital exposure, however, is relatively clear: one bill, in one year, for one device.
Microinverter architecture
Microinverters place a small inverter behind each panel or pair of panels, converting DC to AC at the module. They operate at low DC voltages (typically 20 to 60 V), avoid high-voltage DC wiring on the roof, provide independent maximum power point tracking for every module, and distribute failure: if one unit fails, the other panels continue producing. Their rated life is commonly quoted at 25 years, with warranties of 20 to 25 years from leading manufacturers, reflecting designs that frequently avoid electrolytic capacitors in favour of film capacitors and employ conformal coating and sealed enclosures.
These warranties are meaningful, but they come with a distinct economic and logistical profile. The number of devices is large, typically 8 to 20 in a domestic system, so the statistical probability that at least one fails during the system life is considerably higher than for a single inverter even if per-unit reliability is better. Each device sits behind a panel on the roof, in a high-temperature environment: dark roof surfaces under summer sun can reach 60 to 80 degrees Celsius, and the microinverter sits within a few centimetres of the module back. Replacing a failed unit requires roof access, often scaffolding or a roof ladder system, and in many cases the removal of the panel it serves.
Replacement labour and access overheads
For microinverters, the cost of the part is only a fraction of the cost of the replacement. A failed unit may cost 100 to 200 pounds as a component, but the labour, access equipment and lost generation can raise the total event cost to 400 to 900 pounds, particularly if scaffold is required. Under warranty, the manufacturer typically supplies the replacement unit but not the labour, meaning the owner bears the access cost. Over a 25-year life, a domestic array with 14 microinverters at an assumed 0.5 per cent annual failure rate per unit would be expected to experience roughly 1.75 failures. Each one produces a discrete cost event and a partial generation loss until repaired, in contrast to the single large event of a string inverter.
Hybrid and battery-integrated systems
Hybrid inverters, which combine solar conversion and battery management in one unit, concentrate more functionality and more cost in a single device. A hybrid inverter replacement can cost twice or three times as much as a string inverter for the same power rating, because the equipment includes battery interface hardware, backup power switching and more complex control electronics. A failure also disables battery operation and any backup supply function, not only the solar generation. For these systems, mid-life inverter replacement is the largest single variable in whole-life cost.
| Parameter | Central string inverter | Hybrid string inverter with battery | Panel-level microinverters |
|---|---|---|---|
| Inverter System Topology | Single wall-mounted unit fed by high-voltage DC strings. | Single unit combining PV conversion, battery interface and backup switching. | One unit per panel or pair of panels, converting to AC at the roof. |
| Average Operational Lifespan | Typically 10 to 15 years, with a notable failure cluster between years 8 and 12. | Typically 10 to 12 years; the greater complexity and thermal load shorten the realistic window. | Typically 20 to 25 years per unit, though individual failures occur earlier. |
| Dominant Electrical Failure Mechanism | Electrolytic capacitor electrolyte evaporation and MOSFET solder fatigue from daily thermal cycling. | Capacitor ageing and power stage fatigue, compounded by battery-side converter stress and relay wear. | Roof-level thermal stress, moisture ingress and surge damage on individual units. |
| Typical Mid-Term Replacement Capital Cost | Approximately £800 to £1,500 fitted for a 3 to 6 kW unit. | Approximately £1,500 to £2,500 or more fitted, depending on power rating and battery compatibility. | Approximately £400 to £900 per failure event including access; cumulatively comparable over the life. |
| Overall Asset ROI Impact Profile | One predictable lump sum around year 10 to 12; extends payback by roughly one to two years. | The largest single hit; can extend payback by two to four years and materially reduces NPV. | Small, scattered costs and partial generation losses; higher upfront cost offsets the lower replacement exposure. |
The cost ranges in the matrix are indicative of the UK market and will vary with installer, region, access and the date of replacement. Equipment prices for inverters have generally trended downward in real terms over a decade, which partly offsets inflation in labour cost, and a replacement in the 2030s may use better technology at lower cost per kilowatt than today. Prudent financial models nonetheless hold the cost in real terms constant rather than assume price falls.
Quantifying depreciation and recalculating ROI
The model: a representative domestic array
To demonstrate the effect, consider a 4 kWp array installed for £6,500 that generates 3,800 kWh per year in its first year, with panel degradation of 0.5 per cent annually. Assume the household self-consumes half of its generation, valued at 25 pence per kWh avoided import, and exports the remainder at 12 pence per kWh, giving a blended value of 18.5 pence per kWh generated and an initial annual benefit of around £703. Assume tariffs are constant in real terms and apply a 5 per cent real discount rate. These assumptions are illustrative; each reader should substitute their own tariff, self-consumption ratio and cost of capital.
The baseline: no replacement
On the idealised assumption that the original inverter runs for the whole 25 years, cumulative undiscounted cash flow turns positive during year 10, giving a simple payback of just under ten years. The undiscounted net gain over 25 years is approximately £10,060, and the net present value at 5 per cent is approximately £2,950. This is the figure most marketing materials imply.
Inserting the year-10 replacement
Now introduce a string inverter replacement at the end of year 10. The cost of the event is borne in a single year, at the exact moment when the system has only just recouped its original outlay. The figures below show the effect across a range of replacement costs.
- Replacement at £800: simple payback moves from year 10 to year 11; the 25-year net gain falls to about £9,260; NPV falls to about £2,460.
- Replacement at £1,200: payback moves to year 12; net gain falls to about £8,860; NPV falls to about £2,215.
- Replacement at £1,800: payback moves to year 13; net gain falls to about £8,260; NPV falls to about £1,850.
- Replacement at £2,500: payback moves to year 14; net gain falls to about £7,560; NPV falls to about £1,420.
Each figure reveals a different aspect of the same shock. The undiscounted loss equals the replacement cost, as expected. The NPV loss is smaller than the headline cost, because the expenditure occurs a decade in the future and is discounted: £1,200 at year 10 has a present value of about £740 at 5 per cent. The payback delay is the most visible effect and the most commercially significant, because a one- to four-year extension changes the risk profile of the asset: a system that appeared to pay back in under a decade now requires 12 to 14 years to recover cost, a period in which tariff changes, house sales and further failures can all intervene.
The compounding scenario: a second replacement
Over a 25-year horizon, a string inverter may require a second replacement if the first replacement unit has a similar life. Adding a second £1,200 event at year 20 reduces the 25-year net gain to about £7,660 and the NPV to about £1,760, relative to the no-replacement baseline of £2,950. In other words, a realistic inverter plan with two replacements consumes roughly 40 per cent of the NPV that the idealised model promises. The ROI remains positive in all of these scenarios, which is an important conclusion in its own right: solar remains a sound investment, but not as sound as the headline suggests.
Sensitivity: what matters most
The conclusions are sensitive to three variables. The first is the self-consumption ratio. Households that use more of their generation directly, through daytime occupancy, an electric vehicle or a battery, earn a higher blended value per kWh and absorb the replacement cost more easily. The second is the electricity price trajectory: if import prices rise faster than inflation, the avoided-cost value of generation increases and the replacement cost is easier to recover. The third is the discount rate: a higher rate reduces the present value of both the future savings and the future replacement cost, but as the savings are spread across more years, higher rates generally penalise the investment more than they ease the replacement burden.
Mitigation and provisioning
Several measures reduce the financial impact of the replacement cycle. Extended warranties, typically offered by manufacturers and installers for a premium, convert an uncertain future cost into a known current one; their value depends on the price relative to the expected cost and probability of failure, and on the creditworthiness of the warrantor. Choosing an inverter with a strong reliability record, film capacitors and a conservative thermal design reduces failure probability. Siting the inverter in a cool, ventilated space, keeping heatsinks clean and ensuring adequate clearance reduce operating temperature and extend capacitor life. For asset managers with portfolios, a sinking fund set at an amount such as 100 to 150 pounds per year per system provides the capital for replacement without disrupting cash flow. Finally, replacing at the first sign of capacitor degradation, in a planned window, is generally cheaper than emergency replacement after a failure that has lost generation.
Reliability data, specification and procurement
Specifiers should treat vendor comparison as a reliability exercise as much as a price exercise. Useful indicators include the rated operating temperature range and derating curve, the type of capacitor used (film or electrolytic) and its rated life at operating temperature, the enclosure ingress protection rating, whether the unit is fan-cooled or passively cooled, the length and terms of the warranty including labour and shipping, the manufacturer's UK service presence and spares availability, and independent field failure statistics where available. Brands that compete aggressively on price, including several widely sold Chinese manufacturers such as Solis and Growatt, and established European brands with higher prices, may offer different trade-offs between purchase cost, support infrastructure and reliability. Without published, audited failure statistics, comparisons rely on installer experience and warranty terms; the latter offer a useful, though imperfect, proxy.
Warranty terms deserve particular scrutiny. A manufacturer warranty that covers parts but not labour, or that requires the unit to be returned to a distant service centre, shifts a considerable share of the cost to the owner. A warranty that is valid only if the system was commissioned by an approved installer, or that is voided by installation in an unventilated space, may be effectively unenforceable. For microinverters, the typical 25-year warranty is a useful advantage, but the labour and access cost of a roof-level replacement remains with the owner unless negotiated otherwise.
Recommendations for specifiers, asset managers and analysts
- Model the replacement explicitly. Include at least one inverter replacement at year 10 to 12 in any 25-year cash flow, with a second where the horizon allows.
- Report NPV and payback together. Simple payback hides discounting, and NPV hides timing; both are needed to understand the replacement impact.
- Match topology to risk tolerance. Choose string inverters for lowest capital cost and straightforward replacement, and microinverters where long warranty, module-level monitoring or shading performance outweighs the access overhead.
- Control the thermal environment. Specify cool, ventilated, shaded locations and adequate clearance for the inverter; every 10 degrees Celsius reduction in operating temperature can roughly double capacitor life.
- Provision a sinking fund. Reserve capital annually for replacement, particularly for portfolios and housing associations.
- Read the warranty for labour and logistics. Confirm who pays for access, labour, shipping and generation loss during downtime.
- Monitor performance. Use data logging to detect early signs of degradation, including rising fault frequency, midday power derating and shutdown on hot days.
Conclusion: the inverter is the weak link in a 25-year asset
A domestic solar array is a composite asset: modules that outlast the mortgage, mounting hardware that lasts as long as the roof, and power electronics that reach end of life in the middle of the investment horizon. Capacitor electrolyte evaporation and semiconductor thermal fatigue are well-understood physical processes, and they place the typical string inverter failure window at years 8 to 12. Microinverters distribute the risk and offer longer warranties, at higher upfront cost and with roof-level service overheads. Hybrid systems concentrate the greatest cost and the greatest risk in one device.
For the representative array modelled here, a single £1,200 replacement at year 10 extends simple payback from ten years to twelve and removes roughly a quarter of the NPV; two replacements consume about 40 per cent. The investment stays positive, which is the reassuring part of the analysis. But the margin is thinner than advertised, and the difference between the marketed return and the achievable return is exactly the size of the inverter budget that nobody put in the brochure. Solar microgrid specifiers, domestic asset managers and financial analysts who build the replacement cycle into their models will produce honest returns, make better technology choices and avoid the unplanned capital event that turns a good investment into a disappointing one.