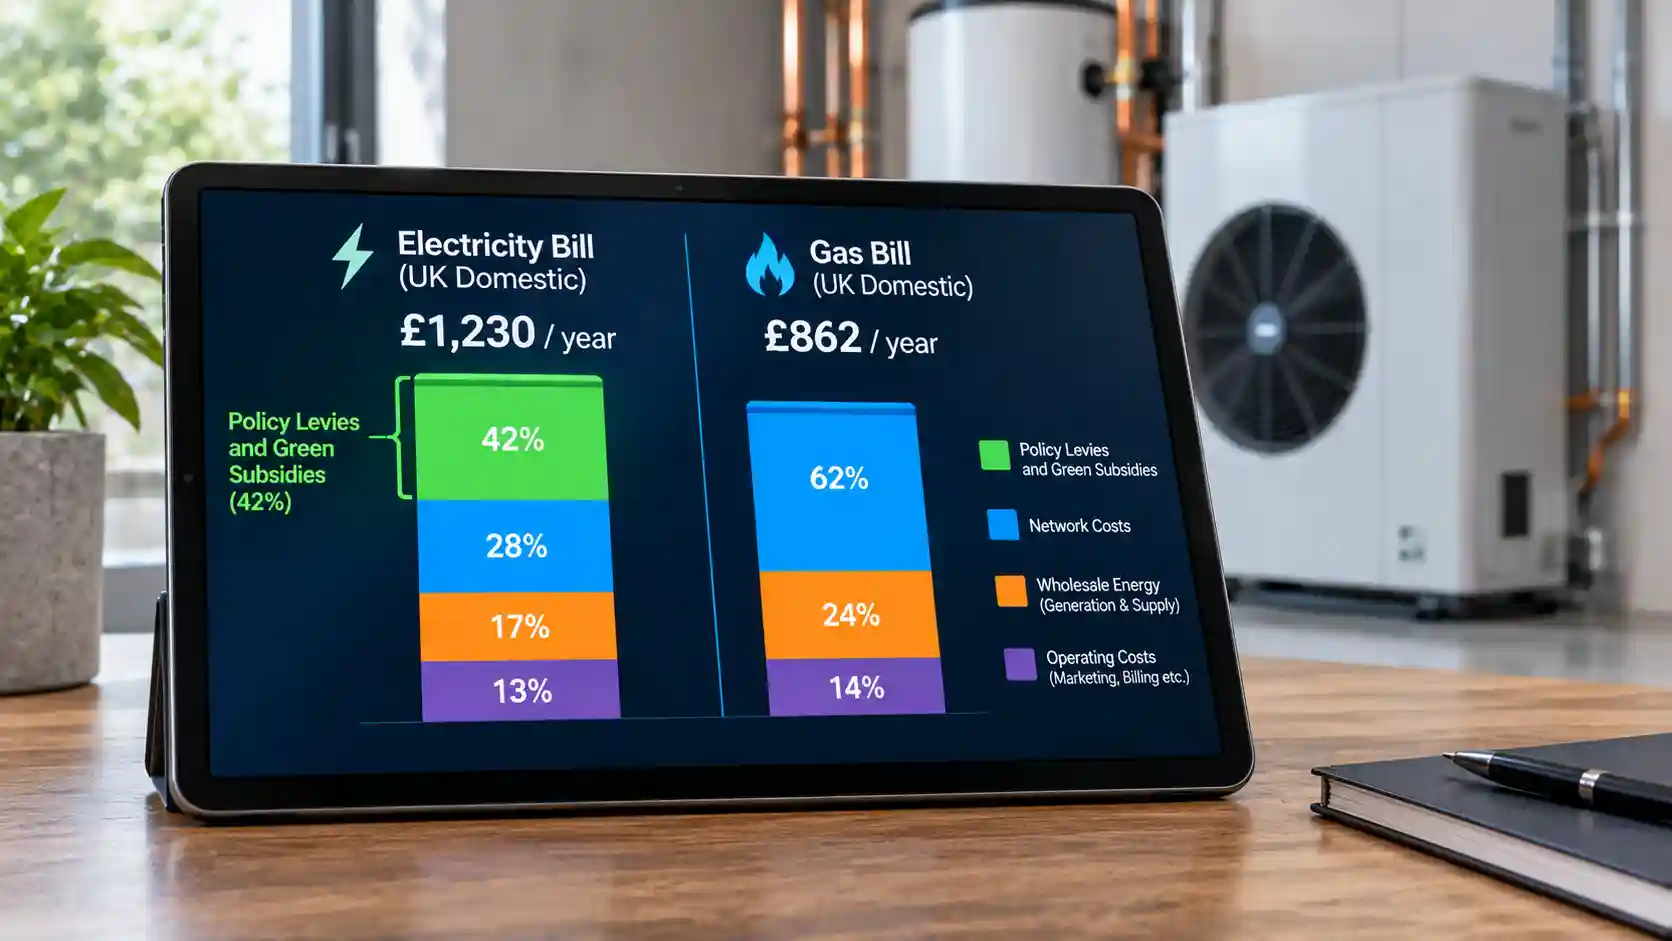
A heat pump can be an excellent piece of thermodynamic engineering and still be a poor financial proposition for the household that buys it. The device itself is indifferent to tariffs: it moves heat at a seasonal coefficient of performance (SCOP) fixed by its design, its flow temperature and the climate. What determines whether it saves or costs money is the price of the energy it consumes relative to the energy it displaces. In the United Kingdom, that relationship is set less by wholesale markets than by the way the cost of policy has been allocated between electricity and gas bills.
This audit examines the architecture of that allocation. It traces how environmental and social obligations were historically loaded onto electricity unit rates, defines the spark spread and the break-even SCOP it implies, models what happens to heat pump economics as policy costs are shifted to gas or to general taxation, and compares the outcomes for very different households. It is written for energy market regulators, social housing asset directors and green infrastructure policy advisors, for whom the question is no longer whether electrification is technically feasible but whether the price signal rewards it.
The anatomy of UK energy bill policy loading
What is in a unit rate
A domestic energy unit rate is a composite. Its principal components are the wholesale energy cost, network costs (transmission and distribution), supplier operating costs and margin, and a bundle of policy costs imposed by government to fund environmental and social programmes. Value added tax at the reduced domestic rate of 5 per cent is applied on top. Standing charges, which recover a share of network and supplier fixed costs, are levied separately per day. The wholesale component is set by market conditions, the network and supplier components by regulation and competition, but the policy component is a matter of deliberate fiscal design.
The UK regime evolved by accretion. Each programme was introduced to deliver a specific objective, funded in the simplest administrative manner available, which was a levy on supplier obligations recovered through customer bills. Because electricity was the carrier for renewable generation and gas was the incumbent fuel, the majority of the costs that relate to decarbonising power ended up being collected from electricity consumers. The structure was reasonable when electricity was a minor share of household energy use and the goal was to build a low-carbon power sector. It becomes counterproductive when the policy objective shifts to moving heat and transport from gas and oil onto the electricity system.
The main policy cost streams
Several distinct programmes make up the policy cost loading. The Renewables Obligation (RO) requires suppliers to source a rising proportion of electricity from eligible renewable generators, passing the cost of certificates through to bills. Feed-in Tariffs (FiT) pay small-scale generators for output and are funded by levy on suppliers. Contracts for Difference (CfD) underwrite the revenue of newer wind, solar and other low-carbon generators at a fixed strike price, with the cost or benefit recovered through a levy that has historically been positive. The Capacity Market pays generators for availability and is recovered from electricity suppliers. Together, these are the legacy renewable and security-of-supply mechanisms, and all of them are recovered on electricity.
On the social and efficiency side, the Energy Company Obligation (ECO), including its ECO4 phase, requires larger suppliers to fund insulation and heating improvements for low-income and vulnerable households, with costs again collected through customer bills. The Warm Home Discount provides a rebate to eligible households and is funded by supplier contributions. These costs have historically been spread across both fuels to varying degrees, but with a disproportionate weighting to electricity because of the way obligations were allocated between supplier customer bases and the way charges were recovered per kWh.
Quantifying the pence-per-kilowatt-hour penalty
Estimates published by regulators and analysts vary by year and methodology, but the pattern is consistent. In recent price cap periods, policy costs have added roughly 3 to 4 pence to each kWh of electricity, representing an order of 12 to 15 per cent of the unit rate, while adding well under 1 pence to each kWh of gas, representing perhaps 5 to 6 per cent of its unit rate. For the purposes of the modelling in this article, a loading of approximately 3.5 pence per kWh on electricity and 0.4 pence per kWh on gas is used as an indicative figure. The values should be updated against the current Ofgem price cap methodology before they are used in a formal assessment.
Recent policy announcements have begun to alter the distribution. The government has indicated that it would remove ECO funding from bills and move a proportion of Renewables Obligation costs from consumer bills to the Exchequer, with effect from 2026, producing an estimated saving on a typical household bill. Readers should verify the current status, scope and implementation timetable of these measures, since the precise reduction in the electricity unit rate will determine where in the scenario range below the market actually sits. The relevance for this analysis is that rebalancing is no longer hypothetical: its mechanism has been conceded, and the open questions concern magnitude and the treatment of the remaining costs.
Why the loading falls on the wrong fuel
The case against the status quo is a simple matter of price signals. Gas combustion releases carbon dioxide at the point of use, yet in the policy cost structure it bears a small share of the costs of decarbonisation. Electricity, increasingly low-carbon and the necessary vector for heating and transport electrification, bears the larger share. The effect is that the lowest-carbon fuel is charged the highest policy premium and the highest-carbon fuel the lowest. That is the reverse of what an economist would design if the objective were to shift demand from the second to the first. It is a legacy of administrative convenience, not a considered choice.
The spark spread and thermodynamic tipping points
Defining the ratio
In wholesale power markets, the spark spread is the difference between the price of electricity and the cost of the gas needed to generate it, adjusted for plant efficiency. Retail heating economics have a closely related concept, which this article uses as shorthand: the retail ratio of the electricity unit rate to the gas unit rate. It is the single most important determinant of whether electric heating can compete with gas. A ratio of 4 means that a kilowatt-hour of electricity costs four times as much as a kilowatt-hour of gas. The ratio is dimensionless and independent of the absolute level of prices, which is why it is so useful in cross-period and cross-country comparison.
The break-even SCOP
A gas boiler delivers heat at an efficiency of about 90 per cent in typical field conditions, so each kilowatt-hour of heat costs the gas unit rate divided by 0.9. A heat pump delivers heat at its seasonal coefficient of performance, so each kilowatt-hour of heat costs the electricity unit rate divided by the SCOP. The running costs are equal when electricity price divided by SCOP equals gas price divided by 0.9. Rearranging, the break-even SCOP equals the price ratio multiplied by 0.9.
This simple relationship reveals a great deal. At a ratio of 4.15, based on an illustrative electricity rate of 27 pence and gas rate of 6.5 pence per kWh, the break-even SCOP is approximately 3.7. A heat pump must achieve a seasonal efficiency of 3.7 simply to match a gas boiler on running cost. That is at the very top of the realistic range for UK retrofit installations, where well-designed systems achieve SCOP of 3.0 to 4.0 and typical systems often fall below 3.5. Most households, therefore, face a modest running cost penalty if they replace gas with a heat pump on a standard tariff, regardless of the quality of the machine.
Why a ratio of 4 is unsustainable
A ratio near 4 places the entire burden of the transition on the efficiency of the heat pump and the skill of the installer. In a market where installers have varying competence, buildings have varying fabric performance and emitters have varying flow temperature requirements, a policy that depends on SCOP above 3.7 in the field is a policy that will frequently fail. It also means that every deficiency, whether in design, commissioning, insulation or user behaviour, converts directly into an increase in running costs relative to gas. Consumers learn quickly from these outcomes, and word of mouth about bills is more powerful than any information campaign about carbon.
Compressing the ratio: scenario analysis
Four scenarios illustrate the effect of rebalancing. All use a gas boiler efficiency of 90 per cent, a heat pump SCOP of 3.2 and an annual heat demand of 12,000 kWh. Prices are in pence per kWh and exclude standing charges.
- Today (electricity 27.0p, gas 6.5p; ratio 4.15): break-even SCOP 3.74. Gas boiler annual heating cost about £867; heat pump about £1,012. The heat pump costs roughly £146 more per year.
- Scenario A, policy costs removed from electricity (23.5p, 6.5p; ratio 3.62): break-even SCOP 3.25. Boiler £867; heat pump £881. Near parity, with the heat pump about £15 dearer.
- Scenario B, policy costs removed from electricity and 1.5p of levy shifted onto gas (23.5p, 8.0p; ratio 2.94): break-even SCOP 2.64. Boiler £1,067; heat pump £881. The heat pump is about £185 cheaper per year.
- Scenario C, deeper rebalancing (20.0p, 8.0p; ratio 2.50): break-even SCOP 2.25. Boiler £1,067; heat pump £750. The heat pump is about £317 cheaper per year.
Scenario A shows the limits of removing levies from electricity alone: because the policy loading is only a portion of the unit rate, the ratio falls from 4.15 to 3.6, which moves the heat pump to approximate cost parity but not decisively below gas. Scenario B demonstrates the additional leverage of loading some cost onto gas, which raises the denominator as well as lowering the numerator. Scenario C illustrates that a ratio of 2.5 requires a larger intervention than policy costs alone can deliver. Reaching it would require shifting further elements of the electricity cost base, such as legacy network and balancing charges, or setting a distinct heat pump tariff, or both. The brief 2.5 to 1 target is achievable, but it should not be presented as the result of removing environmental levies in isolation.
Thermodynamic robustness
The significance of a lower ratio is not only the headline saving. It is the margin of safety it gives to underperforming systems. At a ratio of 2.5, the break-even SCOP of 2.25 can be achieved even by a poorly specified high-temperature installation. A system that achieves a SCOP of 2.8 would still save money against a gas boiler. Lower ratios therefore reduce the risk that installation quality, building fabric or user behaviour will push a household into running cost disadvantage, and they widen the pool of properties for which electrification is economically viable without deep retrofit.
| Parameter | Current framework | Levies removed from electricity | Levies shifted to gas | Deep rebalancing |
|---|---|---|---|---|
| Tariff Design Framework | Policy costs recovered mainly through electricity unit rates. | Policy costs moved to general taxation; unit rates reflect energy and network costs. | As the previous column, plus a portion of costs recovered from gas unit rates. | Policy and some legacy network costs moved off electricity, with a gas-side carbon signal. |
| Average Policy Levy Loading | About 3.5p per kWh on electricity; about 0.4p per kWh on gas. | About 0p on electricity; about 0.4p on gas. | About 0p on electricity; about 1.9p on gas. | About 0p on electricity and a further cut in network cost recovery; about 1.9p on gas. |
| Resulting Spark Spread Ratio | Approximately 4.15 to 1. | Approximately 3.6 to 1. | Approximately 2.9 to 1. | Approximately 2.5 to 1. |
| Baseline Heat Pump COP Viability Threshold | SCOP of about 3.7 needed to match a gas boiler. | SCOP of about 3.3. | SCOP of about 2.6. | SCOP of about 2.3. |
| Consumer Electrification Incentive Level | Negative for most households; the heat pump costs more to run than gas. | Neutral; roughly cost parity for a well-performing system. | Positive; clear running cost saving for a SCOP of 3.0 or above. | Strongly positive; saving even for modest performing systems. |
The figures in the matrix are illustrative and rounded. They exist to demonstrate the structure of the effect, not to forecast the outcome of any specific policy. The gas-side loading of 1.9p in the third and fourth columns reflects the assumed 0.4p existing loading plus the 1.5p levy shift used in the scenario analysis.
Multi-tier consumer impact variations
The high-demand electrified home
Consider a household with a heat pump, an electric vehicle and ordinary domestic electrical demand. Assume 12,000 kWh of annual heat demand at a SCOP of 3.2, giving 3,750 kWh of heat pump consumption; an EV covering 8,000 miles at 3.5 miles per kWh, adding about 2,290 kWh; and other household electricity of 2,700 kWh. Total electricity consumption is approximately 8,740 kWh. At today's 27.0p, the annual electricity bill, excluding standing charge, is about £2,360. With policy costs removed from electricity (23.5p), the bill falls to about £2,050, a saving of about £310. In the deeper rebalancing scenario (20.0p), the bill is about £1,750, a saving of about £610.
For this household the saving does not depend on the gas shift, because it has no gas bill to bear it. The household is the principal beneficiary of electricity-side rebalancing, and it is also the household the policy is trying to produce more of. It is relatively affluent, owns its home, can finance upfront costs, and responds to marginal price changes. Its decisions are therefore sensitive to the signal that the rebalancing sends.
The gas-reliant household
Now consider a household that relies entirely on gas for heating and cooking, with low electricity consumption. Assume 9,000 kWh of gas and 2,200 kWh of electricity, typical of a smaller or lower-income home. Under Scenario A, in which policy costs are removed from electricity only, the household benefits by about £77 per year from lower electricity rates (2,200 kWh at 3.5p) and bears no gas cost. Under Scenario B, in which 1.5p of levy is shifted to gas, the gas bill rises by about £135 (9,000 kWh at 1.5p), while the electricity bill falls by £77. The net effect is an increase of roughly £58 per year.
This arithmetic is the central distributional problem of rebalancing. A reform that makes electrification economically attractive for heat pump owners would make the gas-reliant household worse off if the cost were shifted to gas unit rates, and that household is disproportionately likely to be in fuel poverty, to rent its home and to lack the capital to switch. A responsible policy design therefore requires either that rebalanced costs be funded from general taxation, that the gas loading be paired with a targeted rebate or social tariff, or that the transition be accompanied by funded installation programmes that move vulnerable households onto the electrified side of the market.
Social housing and the landlord-tenant problem
For social housing providers, the incentives differ. The landlord typically bears the capital cost of heat pump installation, while the tenant bears the running cost. A tariff structure that makes heat pumps more expensive to run than gas may deliver carbon savings while increasing tenant bills, which is both a welfare and a reputational risk, and one that regulators of social housing are well placed to see. A ratio below 3 changes the proposition: it allows landlords to specify heat pumps with confidence that tenants will not face higher bills, supporting retrofit at scale and making it easier to justify capital expenditure to boards and funders.
The electrified home without a heat pump
A household with an EV but gas heating benefits from electricity-side rebalancing in proportion to its electricity consumption, while remaining exposed to any gas-side loading. Under Scenario B, an EV owner with 4,500 kWh of electricity and 13,000 kWh of gas would save about £158 on electricity and pay about £195 more on gas, a net cost. That is a feature of the design, not a flaw: it is the price signal that encourages the household to adopt a heat pump. It is also an argument for sequencing policy so that support for heat pump installation precedes or accompanies any gas-side charge, so that households have a means to respond to the signal.
Public finance and the cost of rebalancing
Moving policy costs from bills to taxation does not remove them; it relocates them. The Exchequer must fund obligations that were previously recovered through bills, either by raising revenue elsewhere, borrowing or reducing other spending. The efficiency argument is that general taxation is generally less regressive and less distorting than a per-kWh levy, because bills are a larger share of income for poorer households and because a per-kWh charge distorts fuel choice. The counter-argument is that it increases pressure on public finances and exposes the funding of programmes to annual budget decisions rather than a statutory obligation. A credible rebalancing therefore specifies the funding source, the duration and the mechanism for protecting legacy contracts that investors rely on.
Beyond unit rates: standing charges, time-of-use and flexibility
Unit rate rebalancing is only one dimension of tariff design. Standing charges, which average tens of pence per day for each fuel, represent a fixed cost of connection that does not vary with usage. A household that disconnects from the gas network eliminates one standing charge, which can offset a significant proportion of any running cost penalty from heat pump operation. The potential for this saving is rarely included in simple comparisons and is one of the more powerful arguments for full rather than partial electrification.
Time-of-use tariffs and heat pump specific tariffs offer further scope. A heat pump with thermal storage can shift a significant proportion of consumption into off-peak periods, achieving a blended unit rate substantially below the standard rate. A household on such a tariff, with a rate of 15 to 18 pence during the cheapest periods, may achieve a ratio of 2.5 to 3 even without any levy reform. The interaction between rebalancing and flexible tariffs is complementary: the lower the baseline ratio, the greater the value of every additional pence saved through flexibility, and the larger the share of households for whom electrification is clearly economic.
Implications for regulators, asset directors and policy advisors
- Treat the price ratio as the primary indicator. Monitor the electricity to gas unit rate ratio as a headline metric of electrification policy, with a target range in the vicinity of 2.5 to 3.
- Specify the funding source. Set out explicitly where displaced policy costs will be recovered and over what period, with protection for legacy contract holders.
- Protect vulnerable households. Pair any gas-side loading with targeted rebates, social tariffs or funded electrification, so that gas-reliant households are not made worse off.
- Sequence the reforms. Lower electricity costs first, then add gas-side signals as installation capacity and support schemes mature.
- Underwrite housing portfolios against a range of ratios. Social housing asset directors should model heat pump running costs at ratios from 2.5 to 4.2, and select designs that remain viable at the upper end through low flow temperatures and fabric improvement.
- Combine tariff reform with performance assurance. A low ratio reduces risk, but it does not substitute for good design, commissioning and monitoring of SCOP in the field.
Conclusion: the price signal is the policy
The UK has built a decarbonisation strategy that depends on moving heating and transport onto electricity, while maintaining a tariff structure that makes electricity the more heavily taxed carrier. The mismatch is not a fault of the technology: a heat pump with a SCOP of 3.2 uses roughly a third of the energy of the gas boiler it replaces. The mismatch is a fault of price architecture, and it can be corrected by deliberate fiscal design.
The analysis shows that removing policy costs from electricity brings the heat pump to approximate cost parity with gas, that adding a modest gas-side loading makes electrification clearly economic, and that reaching a ratio of 2.5 to 1 requires reform that goes beyond policy levies alone. It also shows that the distributional consequences are real: the electrified home gains the most, and the gas-reliant household can lose unless protections are designed in. For regulators, social housing asset directors and policy advisors, the lesson is that the price signal is itself the policy. When it points the wrong way, no amount of grant funding, installer training or public information will fully compensate. When it points the right way, it turns the efficiency advantage of the heat pump from a laboratory result into a line on the household bill.