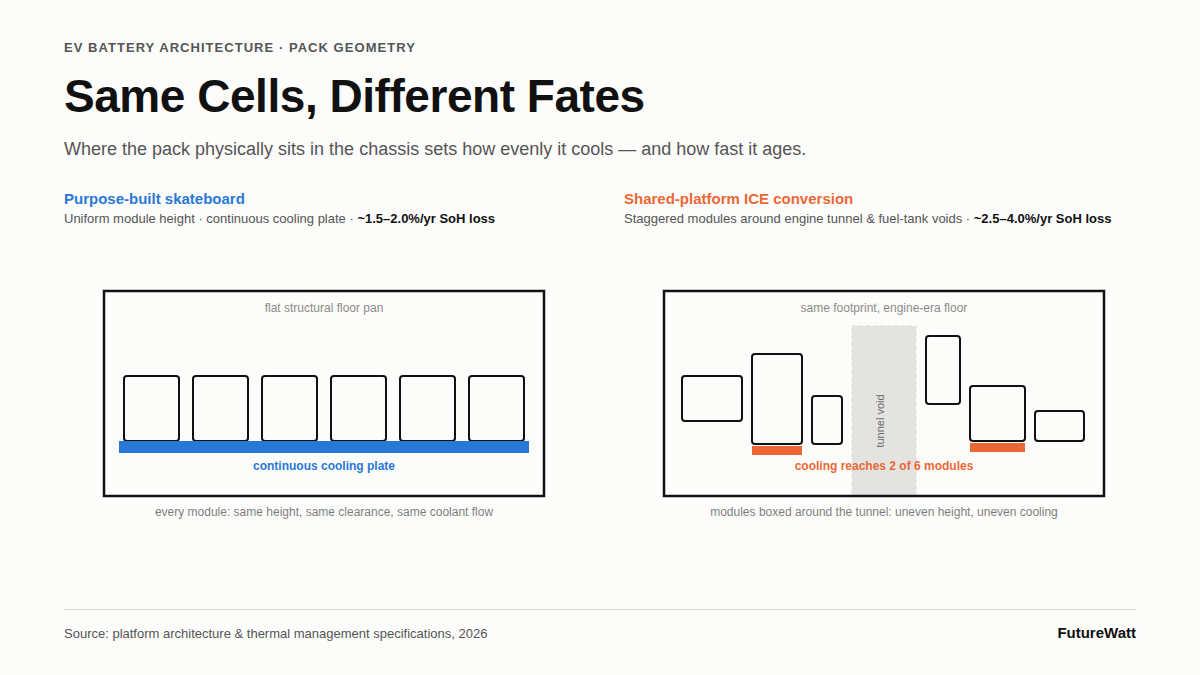
The Geometry of Degradation: Skateboard vs ICE Conversions
Two batteries built from identical cells can degrade at meaningfully different rates purely because of where the pack physically sits inside the vehicle. A purpose-built "skateboard" platform — the flat, structural underfloor architecture used by dedicated EV designs such as the Tesla Model 3/Y and the Hyundai/Kia E-GMP family — engineers the entire floor pan around the battery from the outset. Every module sits at a uniform height, on a continuous cooling plate, with predictable clearances and a load path designed specifically to protect the cells in an impact.
A shared multi-energy conversion inherits none of that freedom. The battery has to be shoehorned into whatever irregular voids remain once the internal combustion engine's exhaust tunnel, transmission housing, and fuel tank cavity have already claimed the useful volume. Modules end up staggered in height, split across separate enclosures, or wrapped around obstructions that a clean-sheet design would never tolerate. That packaging compromise has three direct consequences for pack longevity: cell-to-cell spacing becomes inconsistent, structural impact protection has to be retrofitted rather than engineered in from the first line on the drawing board, and — critically for state-of-health retention — coolant or air cannot be routed uniformly across every module. A pack that cannot be cooled evenly cannot age evenly, and uneven ageing is the single largest driver of premature capacity loss and internal imbalance in the used EV market.
Thermal Management and Cell Degradation Profiles
The table below sets out how these two architectural approaches translate into measurable degradation outcomes.
Platform Architecture | Thermal Management Layout | Average Annual SoH Loss | Core Cycling Stress Factor | Primary Failure Profile |
|---|---|---|---|---|
Dedicated EV Skateboard (e.g., Tesla Model 3/Y, Hyundai E-GMP) | Active liquid cooling via dedicated internal cooling ribbons routed beneath every module | ~1.5% to 2.0% | Uniform volumetric expansion stress across the pack | Gradual, largely predictable capacitive fading |
Shared Multi-Energy ICE Conversion (early legacy conversions, tight packaging variants) | Passive air cooling or restricted, localised cooling plates covering only part of the pack | ~2.5% to 4.0% | Thermal gradient variations across the pack | Accelerated localised impedance growth and cell-to-cell imbalance |
The gap between those two annual loss figures compounds. Over a ten-year ownership window, a skateboard platform's cells are typically tracking towards 80–85% state-of-health, while a poorly packaged conversion running at the upper end of its range can already be approaching the 70% threshold most manufacturers treat as end-of-life for automotive duty.
The Mathematics of Capacity Fading: Calendric vs Cyclic SEI Growth
- The SEI layer penalty. Every charge cycle grows a thin Solid Electrolyte Interphase (SEI) layer on the graphite anode. This layer is necessary — it passivates the anode surface — but its growth is not free: it irreversibly consumes active lithium ions that would otherwise be available for capacity. SEI growth is not confined to active use. It continues while the vehicle is parked, and its rate accelerates sharply during prolonged storage at a high state of charge (above roughly 80% SoC) and at high ambient temperature. This background, time-driven fade is calendric degradation, and it is why two identical packs of the same age can show very different state-of-health purely as a function of climate and charging habits, independent of mileage.
- The thermal gradient trap. In a poorly packaged ICE conversion, modules buried in the centre of the pack run measurably hotter than modules near the pack's exterior edges, because the confined, irregular cooling geometry cannot extract heat from the interior as efficiently as it can from the perimeter. This matters because a cell's internal resistance falls as its temperature rises, and a lower-resistance cell accepts more current for the same applied voltage. During rapid DC charging, the hottest interior cells therefore draw a disproportionate share of the charge current relative to their cooler neighbours — a self-reinforcing cycle in which the hottest cells get hotter, absorb more current, and accumulate accelerated micro-cracking in the anode structure faster than the rest of the pack. This current-driven, use-dependent fade is cyclic degradation, and it is the mechanism most responsible for premature cell-to-cell imbalance in badly cooled packs.
- The dynamic BMS buffer. Purpose-built platforms lean heavily on software to manage the driver's perception of degradation. Manufacturers reserve a top-end buffer of nominal pack capacity — often not disclosed in the vehicle's usable-range specification — and the Battery Management System (BMS) can quietly shift the definition of "100%" downward as the cells age, so the displayed range falls more slowly than the pack's true chemical capacity. This is paired with active cell balancing during charge cycles, which redistributes small amounts of charge between cells to keep the pack's weakest cell from becoming a hard limiter on total usable capacity. The practical effect is that dashboard-reported range is a lagging, smoothed indicator of state-of-health rather than a direct one — which is precisely why a used-buyer audit has to bypass it.
The Second-Hand Buyer Audit: Calculating Remaining Lifespan
A dashboard range estimate cannot be trusted as a state-of-health figure on its own. A proper pre-purchase audit works from raw cell data and known chemical ageing curves instead.
- Diagnostic OBD2 interrogation. Connecting to the vehicle's CAN bus via an OBD2 interface and an appropriate manufacturer-specific diagnostic tool bypasses the dashboard entirely, reading individual cell voltage deltas (the spread between the highest and lowest cell voltage in the pack) and per-module internal resistance values directly from the BMS. A healthy pack shows a tight voltage delta, typically within single-digit millivolts across all cells at rest; a delta climbing into the tens of millivolts, or a small cluster of cells with visibly elevated internal resistance, is the clearest available signature of localised degradation or an early cell fault — long before it would show up as reduced range on the dashboard.
- The direct SoH calculation. State-of-health is defined simply as current full-charge capacity divided by original rated capacity, expressed as a percentage: SoH (%) = (Current Measured Capacity ÷ Original Rated Capacity) × 100. Where a direct capacity test isn't available, remaining lifespan can be estimated by comparing the vehicle's real-world mileage trend against its calendar age: divide total lifetime energy throughput (approximate as total miles driven × the vehicle's real-world kWh/mile consumption) by the pack's usable capacity to estimate total equivalent full cycles delivered, then set that against the chemistry's typical cycle-life rating. A pack losing SoH faster than its calendar age alone would predict is showing cyclic-dominant degradation — the signature of a poorly thermally managed platform — while a pack ageing in line with its calendar age regardless of mileage is showing normal calendric fade.
- Targeting the sweet spot. The lowest-risk used purchase combines an active liquid thermal loop with a chemically stable cell format — either Lithium-Iron-Phosphate (LFP), which tolerates high states of charge and cycling with minimal calendric penalty, or a well-managed Nickel-Manganese-Cobalt (NMC) pack — packaged natively inside a dedicated structural floorplate rather than retrofitted into a converted chassis. That combination of uniform cooling, forgiving chemistry, and purpose-built packaging is what keeps a pack's annual SoH loss in the 1.5–2.0% band across its ownership life, rather than drifting towards the accelerated, imbalance-prone profile typical of a shared-platform conversion.