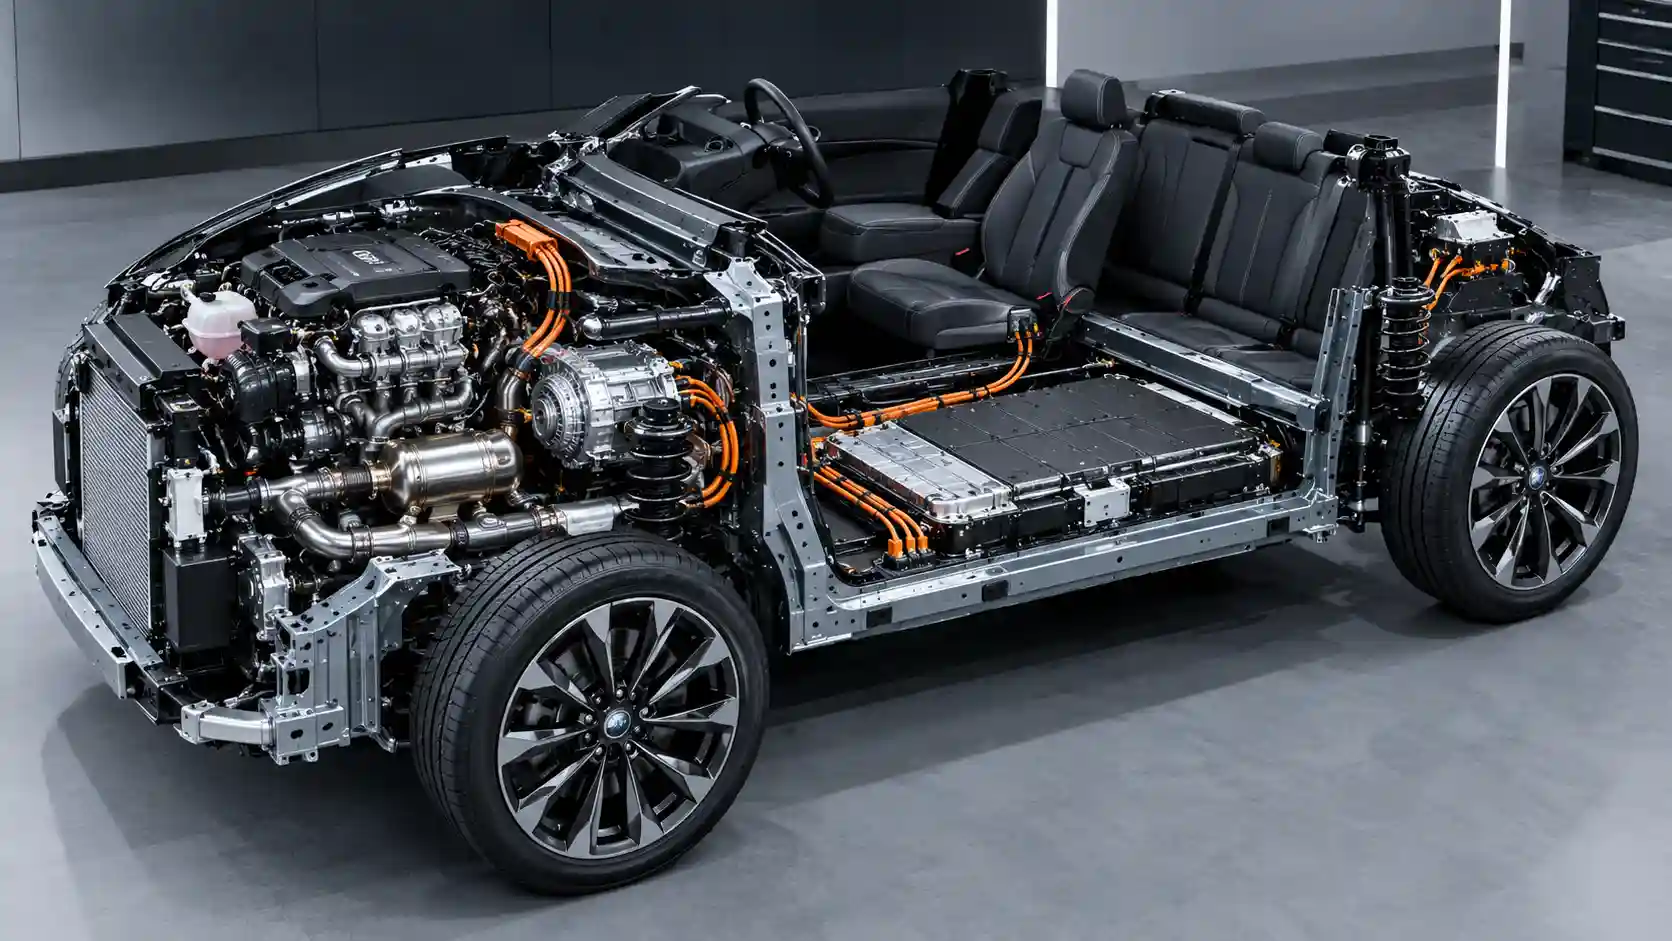
The plug-in hybrid electric vehicle occupies an uncomfortable position in the modern fleet portfolio. It was engineered as a regulatory instrument as much as a mechanical one: a vehicle that could clear tailpipe-emission thresholds on a laboratory dynamometer while retaining the refuelling convenience of a conventional petrol or diesel car. For fleet asset managers, corporate sustainability directors and clean-tech transport consultants, the central question is no longer whether the PHEV is a useful transitional technology. It is whether the financial and environmental case that justified its adoption survives contact with measured, real-world data, and with a Benefit-in-Kind regime that is steadily withdrawing the advantage on which that case was built.
This audit deconstructs the PHEV on four fronts: the mechanical and mass penalties of carrying two complete powertrains; the gap between WLTP-derived emission figures and observed fuel consumption; the structural shift in UK company car taxation; and the narrow operating envelope in which a PHEV genuinely behaves as a low-carbon asset. The conclusion is neither anti-hybrid nor uncritical. It is a boundary-condition analysis: under one specific set of behaviours the PHEV is excellent, and outside it the vehicle is an expensive, heavy and inefficient petrol car.
The dual-powertrain packaging problem
A battery electric vehicle is, mechanically, a radically simple machine. A traction battery feeds an inverter, the inverter drives one or two electric motors, and a single-speed reduction gear delivers torque to the wheels. There is no clutch, no multi-ratio gearbox, no exhaust system, no fuel tank, no cooling circuit for combustion heat rejection and no lubrication system requiring periodic service. A conventional internal combustion engine (ICE) vehicle is the mirror image: a complex thermal machine, an elaborate transmission, fuel storage and delivery, exhaust aftertreatment and a modest 12-volt electrical architecture.
A PHEV is obliged to carry both. The vehicle must accommodate pistons, connecting rods, crankshaft, valvetrain, turbocharger, fuel pump, fuel rail, injectors, a fuel tank, a catalytic converter and, in modern vehicles, a gasoline particulate filter. Alongside this sits a multi-speed transmission or hybrid dedicated transmission, plus a high-voltage traction battery pack, a power electronics unit, an on-board charger, a DC-DC converter, high-voltage cabling, one or more electric machines and a dedicated thermal management loop for the battery. Each subsystem is individually well engineered. Collectively, they represent a duplication of function that no amount of integration can fully conceal.
The intrinsic 200 kg to 400 kg mass penalty
The most direct consequence of this duplication is mass. Compared with an equivalent conventional model on the same platform, a PHEV typically carries an additional 200 kg to 400 kg, depending on battery capacity, body style and the degree of structural reinforcement required. A 12 kWh to 25 kWh usable battery pack accounts for the largest share, with pack-level gravimetric energy densities for current automotive lithium-ion systems generally sitting in the region of 120 Wh/kg to 160 Wh/kg once casings, cooling plates, busbars and crash structures are included. The remainder comes from the electric machine, power electronics, charging hardware, heavier cabling and the secondary structural reinforcement needed to protect a high-voltage pack in a side-impact or underbody strike.
Mass is not a neutral variable. Rolling resistance scales approximately linearly with vehicle mass. Inertial energy demand during every acceleration event scales with it. Braking energy that is not recuperated is dissipated as heat in proportion to it. Across a mixed WLTP-style cycle, each additional 100 kg typically adds the equivalent of around 0.3 to 0.5 litres of petrol per 100 km to an ICE vehicle's consumption. A 300 kg penalty therefore imposes an unavoidable fuel burden of roughly 1 to 1.5 litres per 100 km on an otherwise identical powertrain, before any other inefficiency is considered.
Thermal efficiency degradation and engine downsizing
Manufacturers attempt to offset the mass penalty by downsizing the combustion engine. A 1.0 to 1.5 litre turbocharged three- or four-cylinder unit, often running an Atkinson or Miller cycle to prioritise thermal efficiency over specific output, is common. The strategy is sound at the level of component engineering: an Atkinson-cycle engine can achieve peak brake thermal efficiency approaching 38 to 41 per cent, well above the 30 to 35 per cent typical of a conventional turbocharged petrol unit.
The difficulty is that peak efficiency is achieved only within a narrow band of the engine map. When the battery is charged and the electric machine is available to share load, the control strategy can hold the engine within that band, or shut it down entirely. When the battery is depleted, the engine must follow driver demand across its full operating range, including the low-load, low-efficiency regions where pumping losses and friction dominate. The vehicle is then moving a mass that includes a largely inert battery, driven by an engine that was sized with the assumption that the battery would assist. The engineering compromise inverts: the architecture that gives efficiency in one state inflicts a penalty in the other.
The electrochemical dead weight problem
A depleted PHEV battery is not simply an empty fuel tank. It remains in the vehicle as several hundred kilograms of lithium-ion cells, cooling hardware and structural enclosure that contribute nothing to propulsion yet continue to impose their full inertial and rolling-resistance cost. In charge-sustaining mode, the vehicle can recover a modest amount of energy through regenerative braking and use it for low-speed electric assistance, but the battery's usable window is deliberately narrowed to protect longevity, and the energy throughput is small relative to the energy consumed by hauling the pack. In a strict engineering sense, the vehicle is carrying a stranded asset: capital expenditure embedded in hardware that is not generating returns.
WLTP versus reality: the utility factor deficit
To understand why measured fuel consumption diverges from official figures, it is necessary to examine how the official figures are produced. The Worldwide Harmonised Light Vehicle Test Procedure (WLTP) tests a PHEV in two states: charge-depleting (starting with a full battery, driving until the battery is exhausted) and charge-sustaining (battery held at a constant state of charge). The two results are then combined using a Utility Factor (UF), a statistical weighting that estimates the proportion of real-world kilometres driven in each state. The higher the assumed UF, the more weight is given to the near-zero charge-depleting result, and the lower the headline CO2 and fuel-consumption figure.
The UF is derived as a function of the vehicle's electric range and is based on assumptions about how often drivers charge and how far they travel between charges. It is a population-level average intended to be representative. It is not a measurement of any individual vehicle's behaviour, and it contains an implicit assumption: that the vehicle is plugged in regularly, ideally every day.
What the tracking studies show
Multi-thousand-vehicle studies of real-world PHEV usage across Europe, drawing on telematics, fuel-card records and on-board fuel-consumption data, have consistently reported the same pattern. Real-world fuel consumption and CO2 emissions are, on average, several times higher than WLTP values, with the gap widening sharply for private-use and, in particular, company-car PHEVs. Published analyses of large European samples have reported average real-world emissions roughly two to four times the official figures, with a substantial portion of company-car vehicles showing deviation far higher than that average. At the unfavourable end of the distribution, vehicles driven predominantly on depleted batteries have been observed consuming fuel at levels up to five times their official combined figure.
The explanation is not mysterious. The official UF for a PHEV with a 50 km electric range implies that a large majority of annual distance is driven electrically. Observed electric driving shares for company vehicles are materially lower, with a significant minority of vehicles seldom or never being charged. For those vehicles, the lab figure is entirely fictional: they behave as a heavy, inefficient petrol hybrid with a vestigial electric assist.
The fuel card disincentive
The behavioural cause deserves specific attention because it is structural, not individual. Many company car drivers receive a fuel card that covers all petrol or diesel purchases, for business and private mileage alike. Electricity consumed at home is, by contrast, a cost borne personally by the driver unless the employer operates a reimbursement scheme, and since the HMRC advisory electricity rate was introduced for company cars, such schemes remain the exception rather than the norm. The result is a rational but perverse incentive: the driver faces a personal cost for charging and no cost whatsoever for refuelling. Where a fuel card is provided, the rational choice for the individual is to leave the charging cable in the boot.
The consequence for the fleet is significant. The vehicle was selected, taxed and approved on the basis of its low-emission headline figure. It is then operated as a pure petrol asset, with the employer funding every litre. The tax advantage is realised; the environmental and operating-cost advantages are not. Fleet managers who have analysed fuel-card spend against telematics data frequently find that their PHEV cohort has higher fuel expenditure per mile than comparable efficient diesel or petrol hybrids, a direct inversion of the business case on which the vehicles were chosen.
Why the deviation compounds
Several secondary effects compound the primary behavioural gap. First, the charge-sustaining WLTP result itself is generated under laboratory conditions that flatter the vehicle: moderate ambient temperature, smooth acceleration profiles and a controlled state of charge. Real-world motorway cruising at 70 mph, cold-weather operation with cabin heating drawn from the engine or the battery, and aggressive driving all push charge-sustaining consumption above the lab figure. Second, the electric range quoted in the specification is itself a laboratory number, and real-world electric range typically falls 20 to 40 per cent short in winter or at motorway speeds, reducing the proportion of any given journey that can be covered electrically even by a diligent charger. Third, where drivers do charge but only occasionally, the vehicle spends long periods in charge-sustaining operation between charges, further reducing average electric share.
The UK Benefit-in-Kind cliff-edge
The PHEV's commercial rationale in the UK has rested overwhelmingly on the company car Benefit-in-Kind (BiK) tax system. BiK taxation is calculated from the vehicle's P11D value multiplied by an appropriate percentage determined by its CO2 emissions and, for hybrids, its zero-emission range. The structure historically rewarded PHEVs with the longest electric ranges and lowest WLTP CO2 figures with very low appropriate percentages, placing them in the same fiscal neighbourhood as fully electric vehicles for much of the past decade.
How the bands have been constructed
Under the current regime, PHEVs are placed in bands according to their electric range. Vehicles with a zero-emission range of 130 km or more occupy the most favourable band, with progressively higher percentages for ranges of 70 to 129 km, 40 to 69 km, 30 to 39 km, and below 30 km, combined with CO2 emissions bands. Pure electric vehicles are currently taxed at a very low percentage, with the government having legislated a gradual annual escalation across the forecast period. PHEVs, because they emit tailpipe CO2, sit above electric vehicles and the gap has been designed to close from the PHEV side: the favourable low-emission bands that PHEVs have exploited are being narrowed, and the effective differential between a PHEV and an equivalent combustion vehicle is shrinking year by year.
This is the core of the cliff-edge. For a fleet operating a 40 per cent taxpayer cohort, the difference between an appropriate percentage of 8 per cent and one of 20 per cent on a £45,000 P11D vehicle is the difference between roughly £1,440 and £3,600 in annual personal tax for the driver, and a corresponding Class 1A National Insurance contribution burden for the employer. When the PHEV's annual BiK liability converges towards that of a combustion alternative, the compelling financial argument for the PHEV evaporates, while its higher purchase price, additional complexity and weight penalty remain.
Capital overheads and residual value exposure
The BiK trajectory is not the only fiscal exposure. PHEVs typically carry a higher list price than the equivalent combustion model, reflecting the cost of the second powertrain. First-year capital allowances for company-purchased vehicles favour zero-emission cars; PHEVs do not qualify for the 100 per cent first-year allowance, and fall into the main or special rate pools depending on emissions. Leasing rates incorporate forecast residual values, and as the tax advantage erodes, used-market demand for PHEVs is exposed to the risk that buyers prefer either a cheaper combustion car or a fully electric vehicle with a more attractive long-term cost profile. Lessors are increasingly pricing this uncertainty into contract hire rates.
For a fleet manager, the practical risk is a mismatch of horizons. A vehicle ordered today on a three- or four-year lease will be driven through the very period in which the BiK differential is compressing. A contract that appears favourable at order may deliver a materially worse total cost of ownership by the time of handback, and the driver may find themselves with a higher tax bill than they were quoted at selection. Employee satisfaction, retention and salary-sacrifice uptake can all be affected.
Policy direction and fleet planning implications
The direction of travel is clear even where individual rates change. UK policy is oriented towards zero-emission vehicles, with the ZEV mandate shaping manufacturer supply, and with tax regimes progressively rebalanced to favour battery electric vehicles. Hybrids are positioned as a bridge technology with a sunset. Fleet planning that treats the current PHEV advantage as permanent is therefore exposed to repricing risk. The prudent approach is to model each PHEV selection against the forecast BiK trajectory over its full contract term, not the rate in force on the day of order, and to compare it against both a combustion alternative and a battery electric equivalent.
| Parameter | Charge-depleting (disciplined charging) | Charge-sustaining (rarely or never plugged in) |
|---|---|---|
| Powertrain Mode Deployment | Electric machine carries the propulsion load; ICE remains idle or is used only for peak demand and long-range journeys. | Downsized ICE provides virtually all propulsion; the electric machine offers only brief assistance and regenerative recovery. |
| Real-World Fuel Consumption Deviation | Close to, or better than, the WLTP weighted figure for short commutes; deviation rises only on journeys exceeding electric range. | Frequently two to five times the official combined figure, depending on duty cycle and driving style. |
| Dead Weight Penalty | Battery mass is productive: it stores the energy that displaces petrol for each journey. | 200 kg to 400 kg of inert pack mass is hauled continuously, raising consumption by an estimated 1 to 1.5 litres per 100 km. |
| Tax Framework Exposure Level | Moderate: lower running costs partly offset rising BiK percentages and the closing differential against combustion cars. | High: the employer funds all fuel while the BiK advantage is withdrawn, leaving cost with no corresponding benefit. |
| Optimised Infrastructure Use Case | Driver with off-street parking, a smart home charger and an overnight off-peak tariff; daily commute of 30 to 40 miles. | Driver without home charging, long daily mileage or a fuel card that removes any incentive to plug in. |
The narrow optimised operational window
None of the preceding analysis implies that a PHEV cannot be an efficient vehicle. It implies that it is an efficient vehicle only inside a tightly bounded set of conditions. Defining that boundary precisely is the most useful contribution an analyst can make to a fleet selection decision.
Modelling the 30 to 40 mile commute
Consider a driver with a 35-mile round-trip commute and occasional longer journeys. A modern PHEV with a usable battery capacity of around 18 kWh and a real-world electric consumption of approximately 3.5 to 4 miles per kWh at mixed speeds achieves a real-world electric range of roughly 60 to 70 miles in mild weather. In winter, with cabin heating and lower ambient temperatures, this may fall to 45 to 50 miles. Either figure comfortably covers a 35-mile commute with margin to spare.
Under these conditions the sequence is straightforward. The vehicle is plugged in overnight, completes charging within a few hours on a 7 kW home unit, departs in the morning with a full battery, and completes the commute without starting the engine at all. The driver returns, plugs in again, and the cycle repeats. Over a working year of around 220 commuting days, perhaps 7,700 miles of annual distance is fulfilled purely electrically, with the engine reserved for the occasional long trip. Annual fuel consumption can then be a small fraction of that of an equivalent petrol car, and the vehicle's thermal and mechanical burden is minimal.
Charging economics and smart tariffs
The financial case within this window depends on the price of the electricity consumed. On a standard variable tariff, home charging costs perhaps 25 to 30 pence per kWh, delivering a cost of roughly 7 to 8 pence per mile. On an overnight smart or time-of-use tariff offering off-peak rates in the range of 7 to 10 pence per kWh, the cost falls to around 2 to 3 pence per mile, a fraction of the 12 to 18 pence per mile typical of petrol fuel in a conventional hybrid or ICE vehicle. Where the employer reimburses home charging at a documented rate, the economics become transparent and the behavioural obstacle created by fuel cards is neutralised.
Smart charging also allows load management and carbon-intensity optimisation. A charger linked to a time-of-use tariff will draw energy in the overnight low-demand period, when grid carbon intensity is typically lowest and wind generation is often surplus. This is the operating state in which the PHEV is a genuine clean-tech asset: a short-range electric vehicle with a range-extending safety net.
The boundary conditions
The optimised window can be summarised as a set of necessary conditions, all of which must hold simultaneously:
- Daily distance within real-world electric range. Typical daily use must fall comfortably inside the winter electric range, not the headline specification.
- Reliable overnight charging access. The driver must have off-street parking and a dedicated home charge point, with no dependence on public infrastructure for routine use.
- Charging discipline. The vehicle must be plugged in after every use, supported by telematics reporting and, where possible, a reimbursement mechanism for home electricity.
- Appropriate fuel policy. Fuel card controls or incentives must not reward the driver for ignoring the battery.
- Sufficient tax advantage over the contract term. The projected BiK and Class 1A cost must remain favourable against both combustion and battery electric alternatives for the full lease period.
If any one of these conditions fails, the vehicle drifts towards charge-sustaining operation, and the economic and environmental case degrades accordingly.
Practical recommendations for fleet asset managers
The analysis supports a pragmatic, data-led policy rather than a blanket prohibition or endorsement. Fleet managers should consider the following measures.
- Audit before renewing. Compare fuel-card transactions with telematics and charge-session data for every PHEV in the fleet. Identify the proportion of vehicles with an electric driving share below, for example, 50 per cent.
- Segment drivers by duty cycle. Restrict PHEV allocation to drivers who meet the boundary conditions above. Allocate battery electric vehicles to those with home charging and higher mileage, and efficient hybrids or combustion vehicles to those without access to charging.
- Align incentives. Introduce a home-charging reimbursement scheme, and consider restricting fuel-card use for PHEV drivers or monitoring fuel spend against expected electric share.
- Model the full contract horizon. Calculate total cost of ownership using forecast BiK rates for each year of the term, not the rate at order, and include Class 1A National Insurance, charge point installation and residual value risk.
- Report honestly. Sustainability reporting that uses WLTP emissions for PHEVs will overstate the reduction achieved. Use measured fuel consumption from fuel-card and telematics data to produce a defensible Scope 1 and Scope 3 position.
Conclusion: a conditional asset, not a default choice
The plug-in hybrid is neither the clean-tech panacea suggested by its laboratory figures nor the fraud that its harshest critics allege. It is a conditional asset whose value depends almost entirely on behaviour and infrastructure. Its dual-powertrain architecture imposes a permanent mass and complexity penalty of 200 kg to 400 kg, which is repaid only when the battery is regularly and productively used. Its WLTP credentials rest on a utility factor that company-car fuel-card regimes routinely invalidate. Its fiscal advantage under UK Benefit-in-Kind rules is being deliberately eroded, narrowing the gap with combustion alternatives and exposing fleets to capital and residual value risk.
For the minority of drivers who commute 30 to 40 miles, charge every night on a cheap smart tariff and rarely venture beyond electric range, the PHEV remains a well-matched and efficient tool. For everyone else, the thermodynamic and fiscal evidence points in the same direction: the cost of carrying two powertrains is real, it is paid every mile, and the window in which it can be justified is closing. Fleet decision-makers who treat the PHEV as a standardised, default selection risk locking in avoidable cost. Those who treat it as a specialised asset, deployed only where the boundary conditions are demonstrably met, can still extract genuine value from it while they plan the transition to full electrification.